
Written by:
Published
Updated: June 22, 2026
This article explains how to read and interpret a qEEG (quantitative EEG) brain map, based on a clinical webinar led by Dr. Trish Leigh.
Dr. Leigh walks through real qEEG case examples and explains how clinicians identify meaningful patterns in brain maps.
QEEG brain mapping records electrical brain activity and compares it to age and sex-matched normative data.
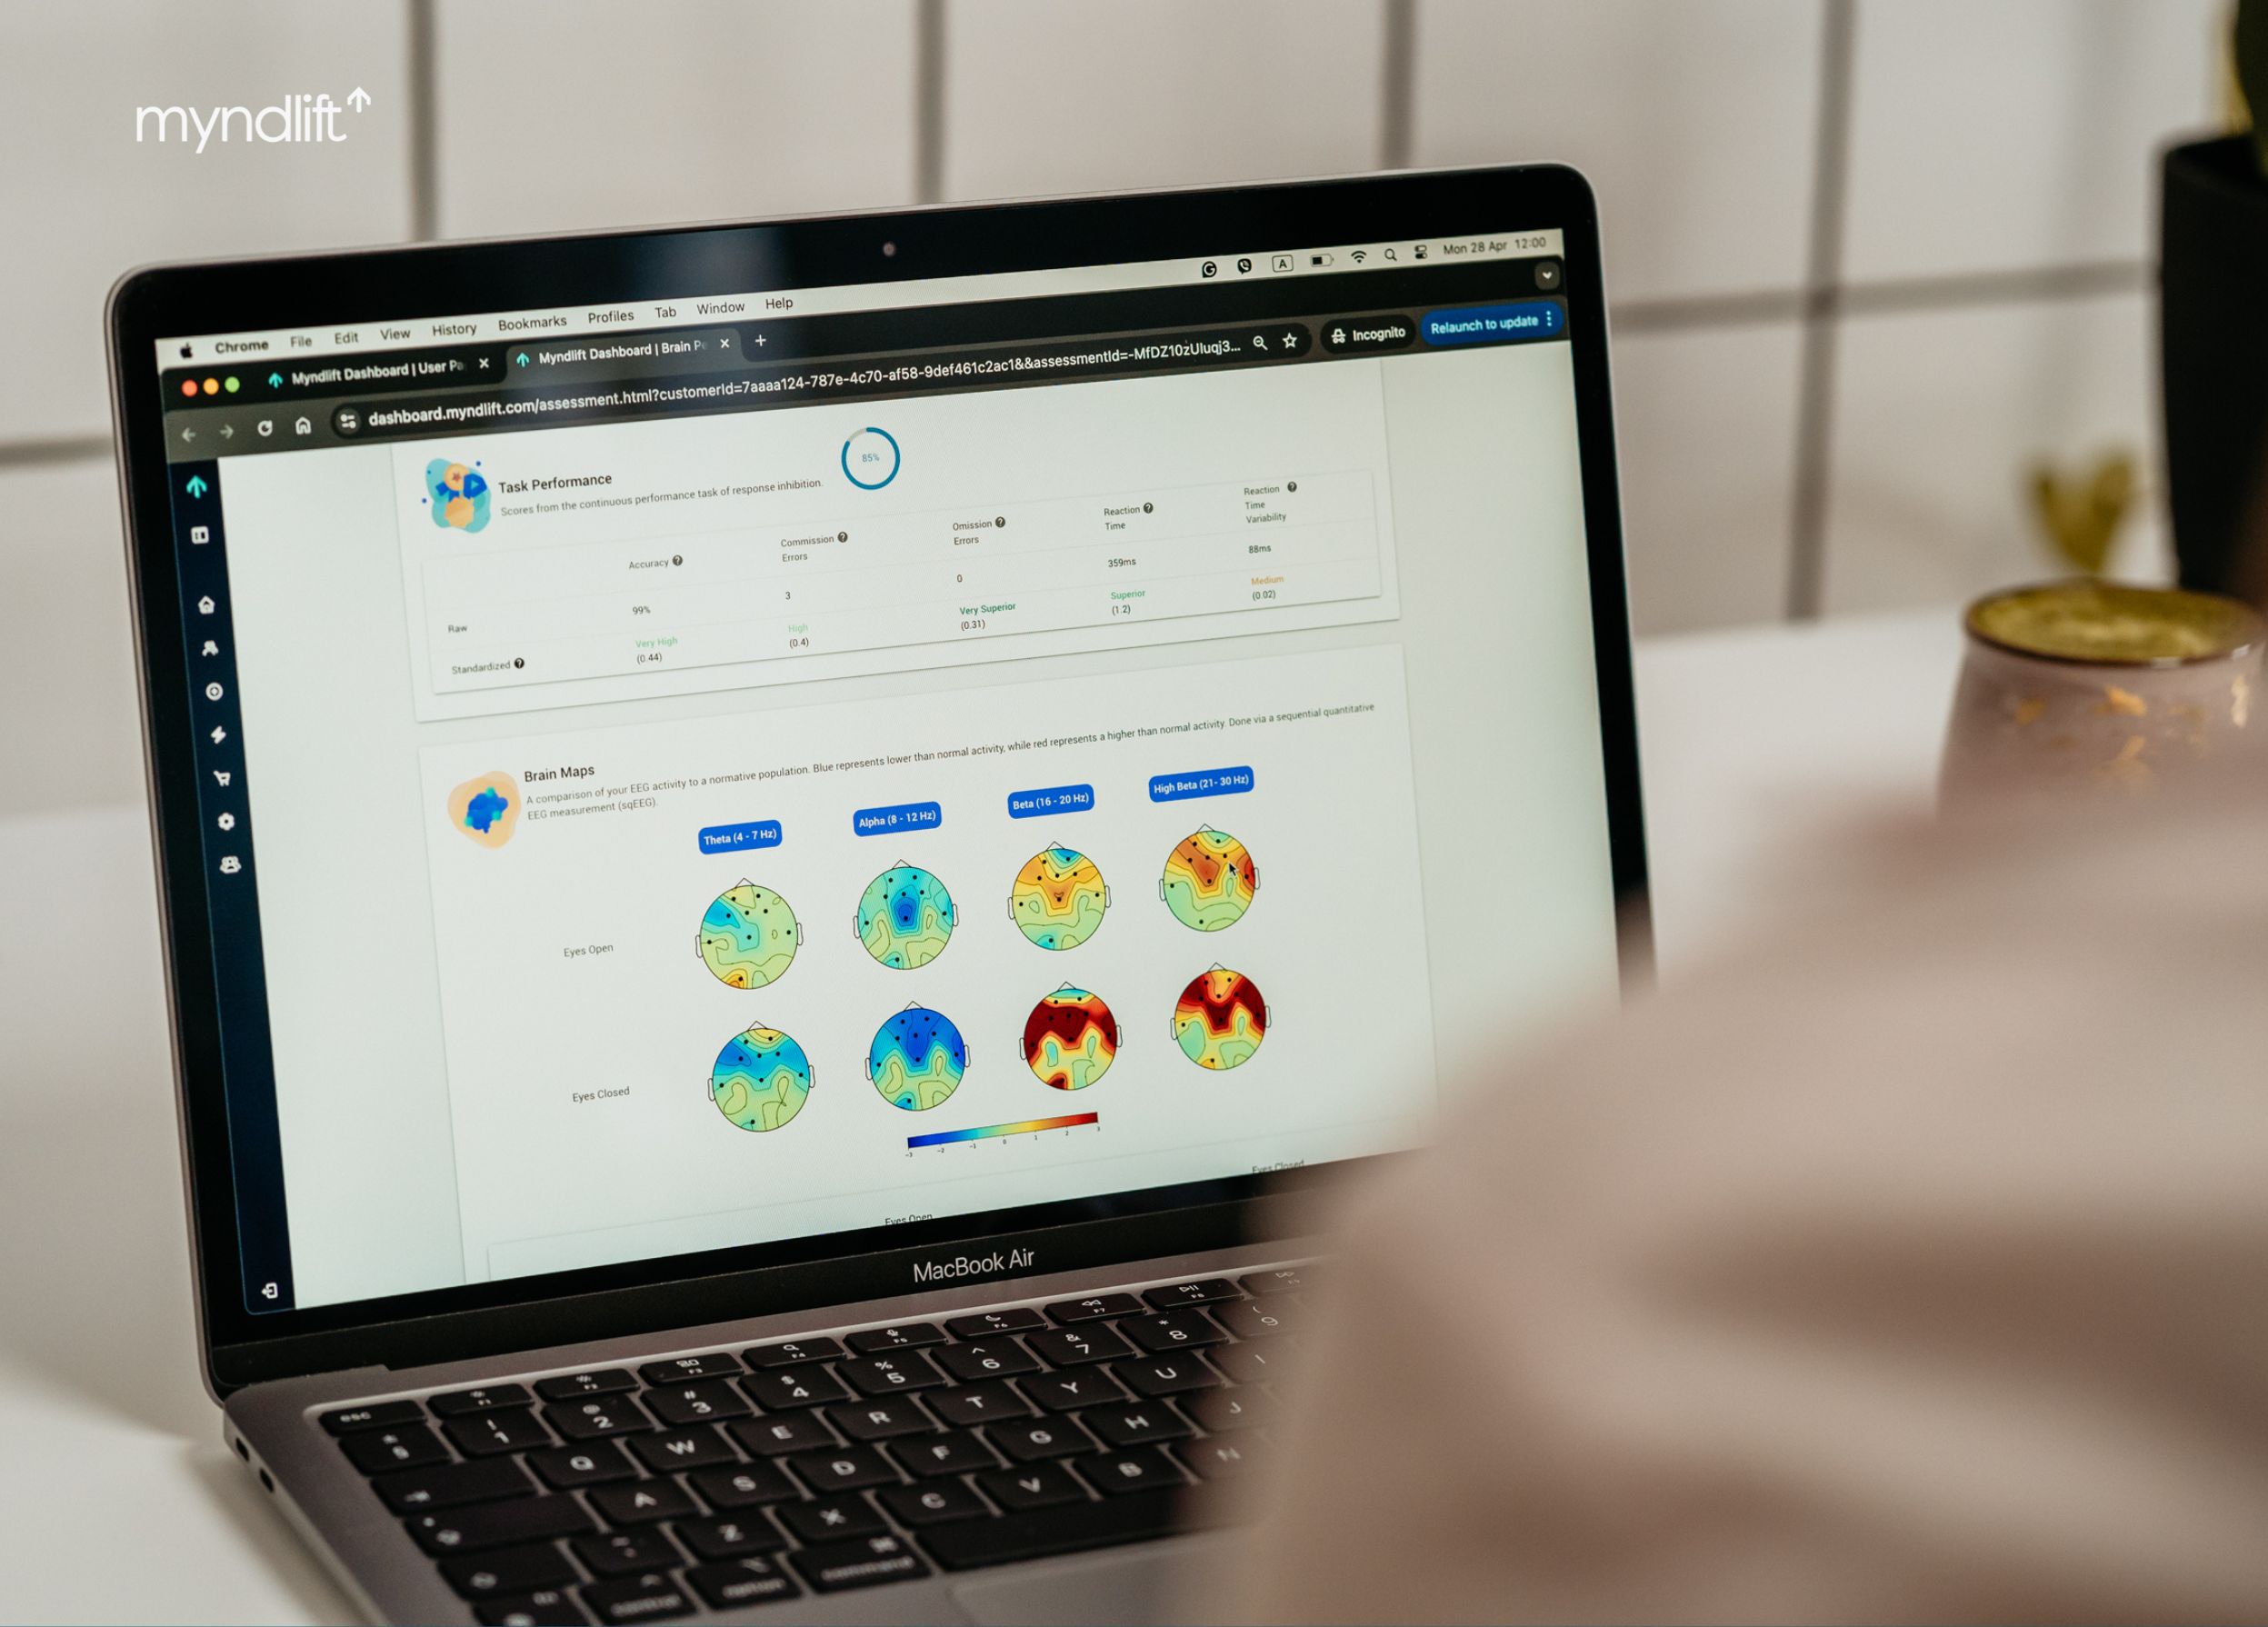
QEEG results are visualized as color-coded maps showing overactivation and underactivation across brain regions.
Brain map interpretation focuses on global, regional, and focal patterns rather than isolated data points.
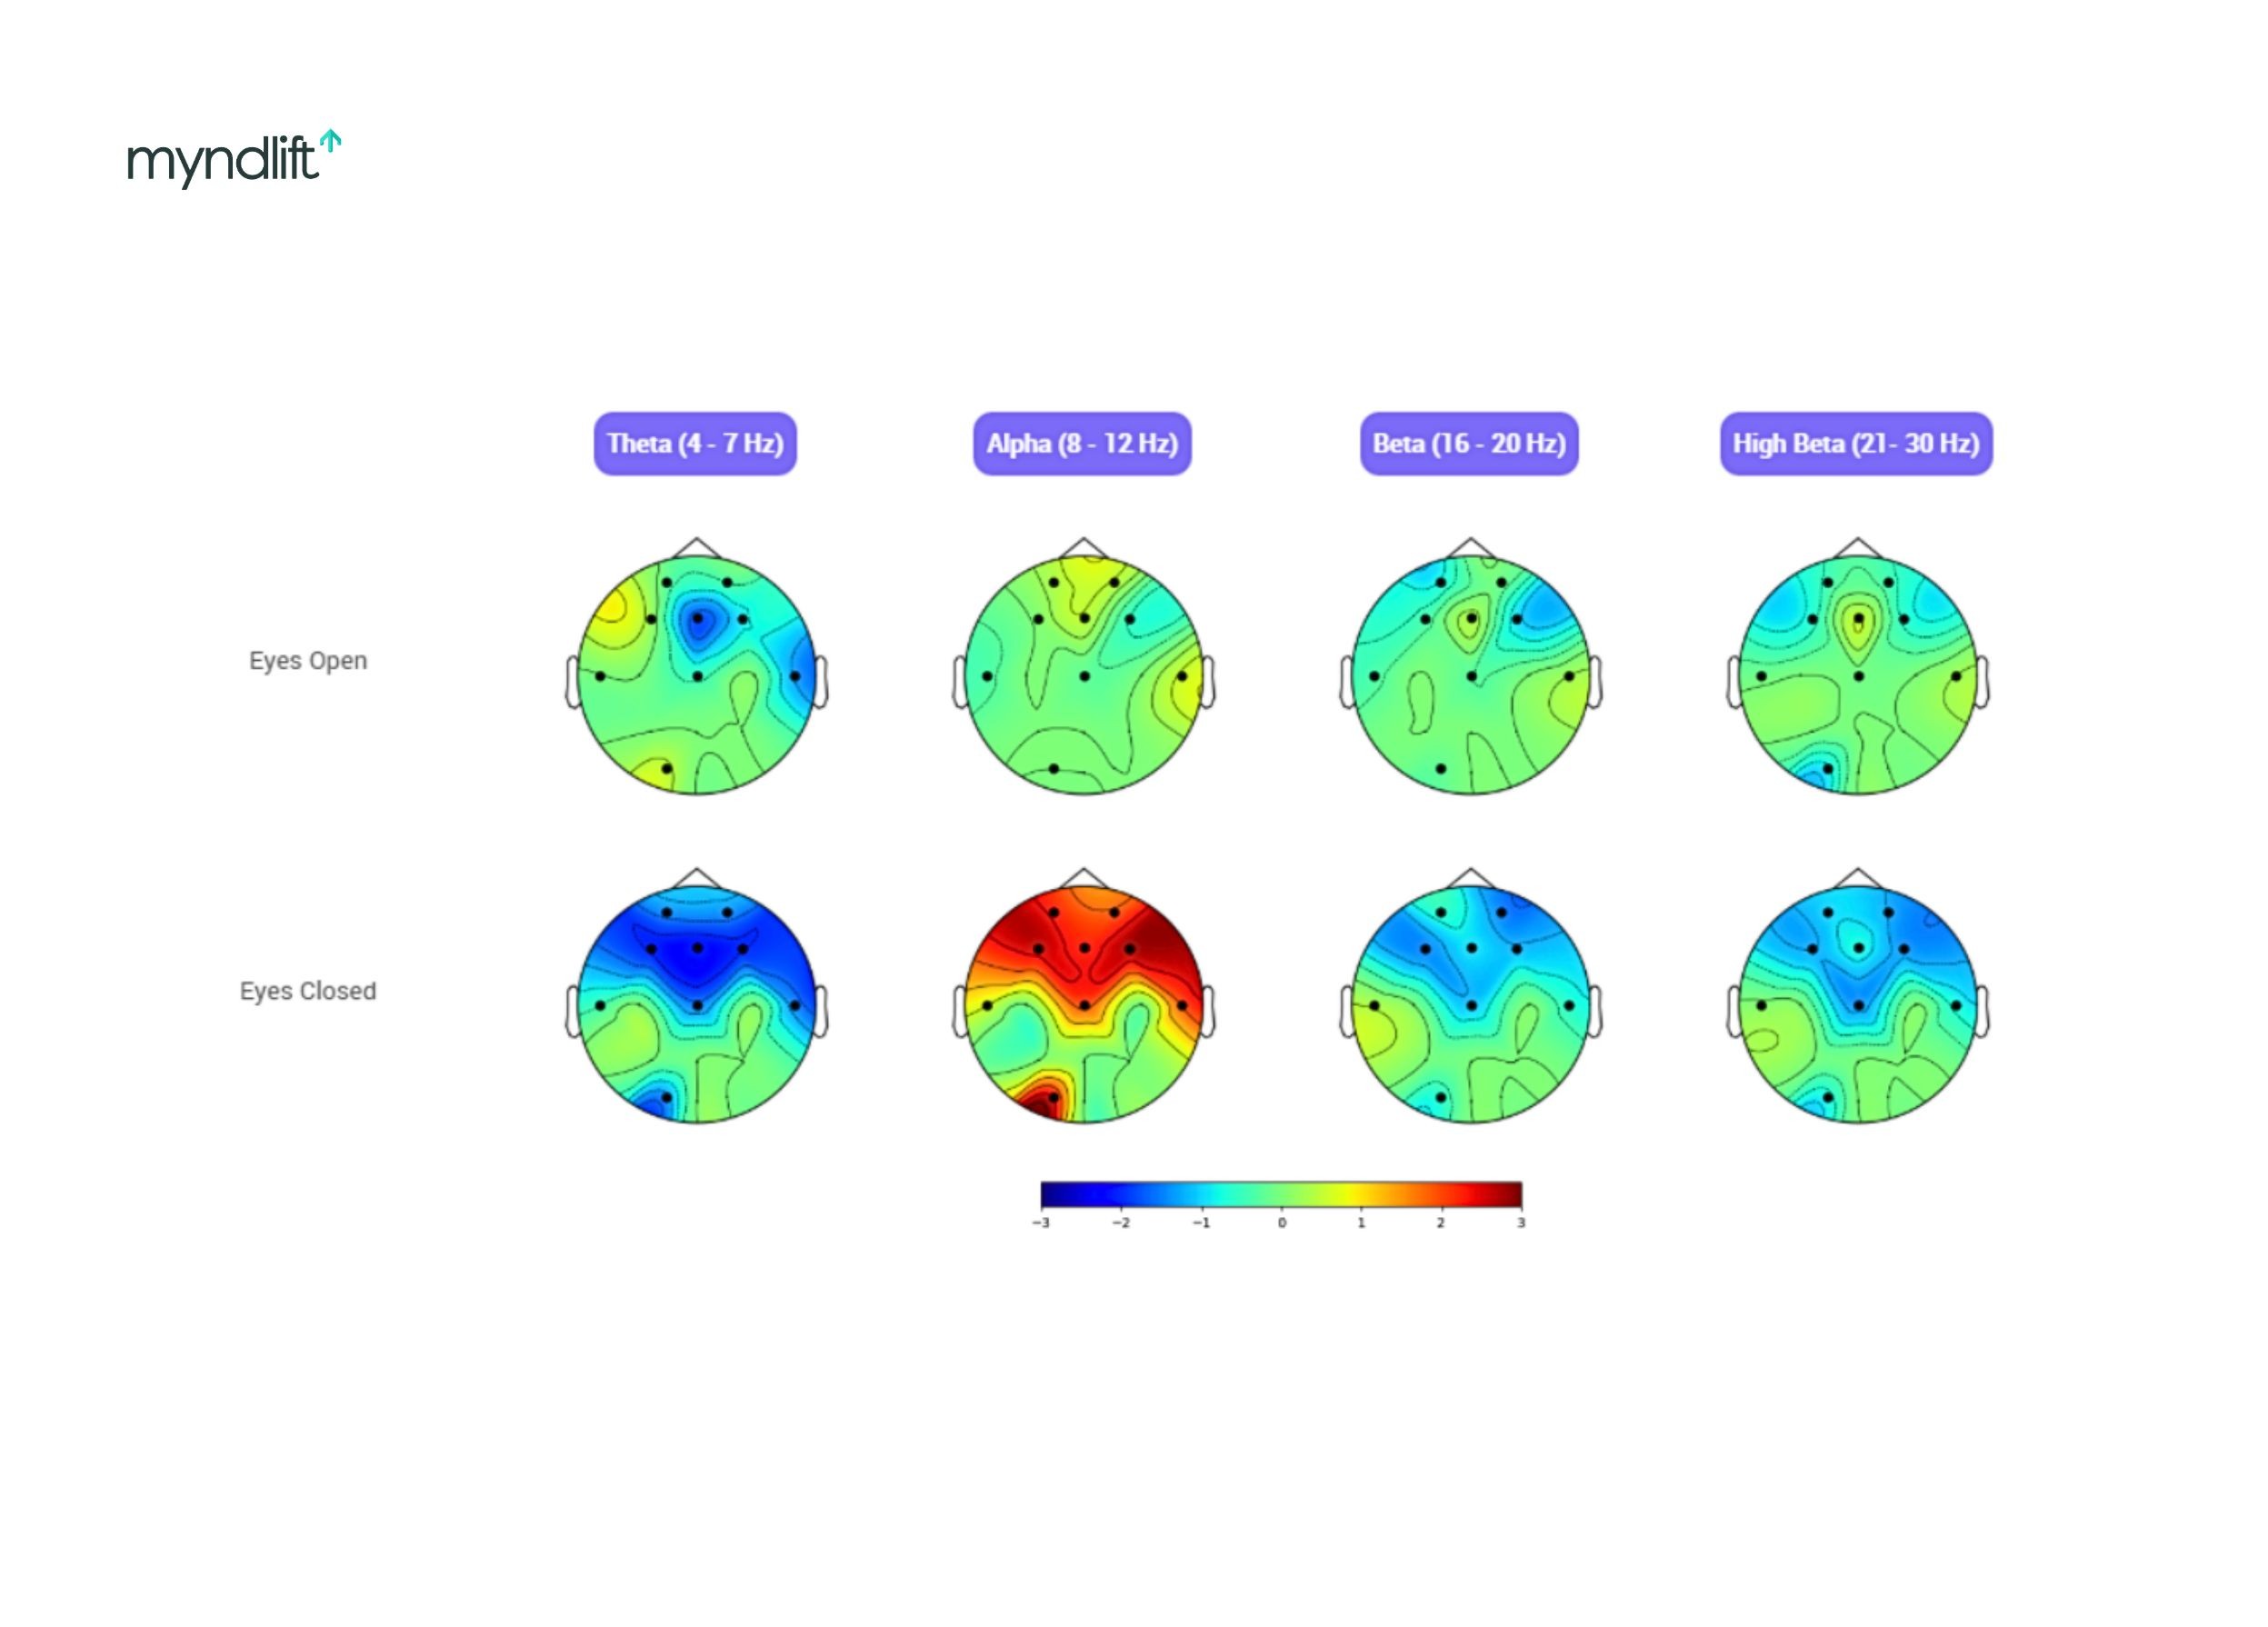
Different brainwave frequencies (delta, theta, alpha, beta, high beta) reflect different aspects of brain regulation.
Eyes-open and eyes-closed brain maps reveal differences between active and resting brain states.
QEEG findings are used by clinicians to guide personalized neurofeedback training.
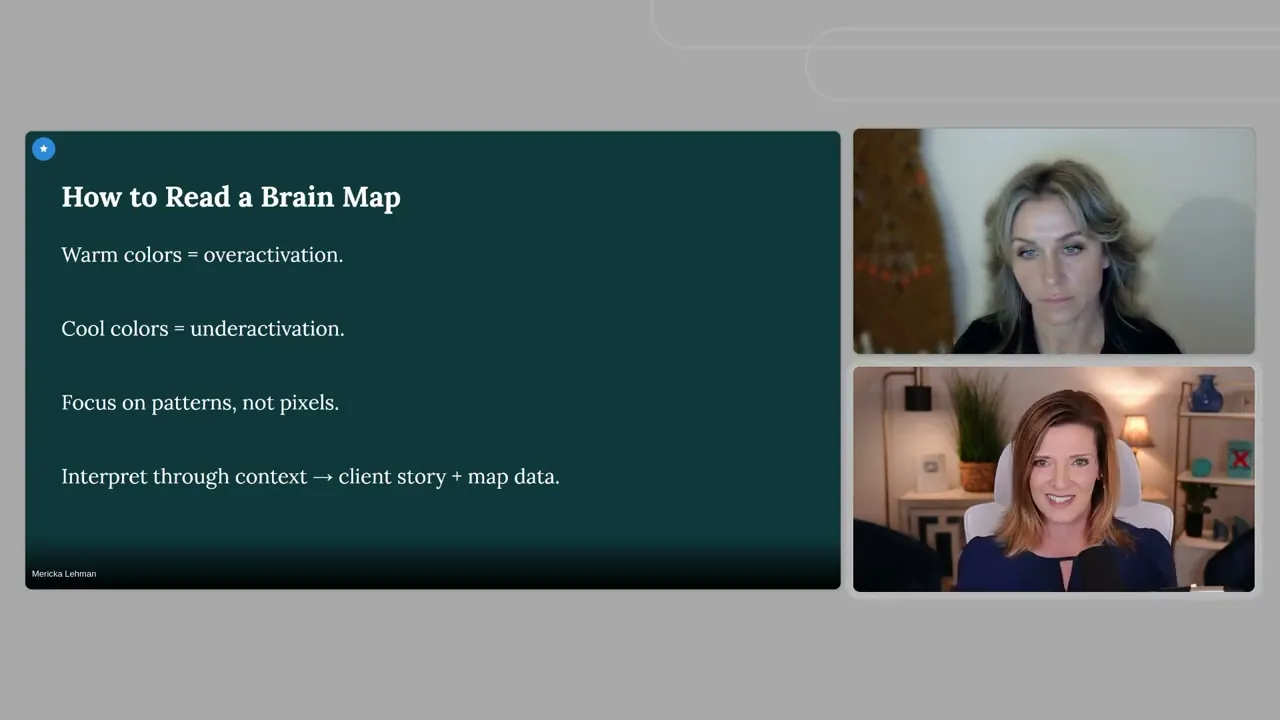
When you first encounter a qEEG brain map, the most noticeable thing is color. Warm areas stand out, while cooler areas catch your eye, and that reaction makes sense because the map is designed to be visual.
With time and experience, the focus naturally shifts.
Instead of isolating individual spots, attention moves toward how areas relate to one another, how activity clusters, and how patterns repeat across regions and states. This is where a brain map begins to carry meaning.
In a recent Myndlift webinar, cognitive neuroscientist and long-time neurofeedback clinician Dr. Trish Leigh walked through how to think while reading a brain map, emphasizing the importance of slowing down, recognizing patterns, and connecting the data to the lived experience of the person in front of you.
As she said early on:
“We’re not looking at pixels. We’re looking at patterns. And those patterns tell the story of a person’s life.”
This guide follows that way of thinking.
What a QEEG brain map actually shows
A qEEG brain map is a snapshot of how a brain is regulating itself at baseline, compared to what’s statistically typical for someone of the same age and sex.
Technically, qEEG stands for Quantitative Electroencephalography. Electrodes record electrical activity (brainwaves) from the scalp. That data is then compared to a normative database and expressed as Z-scores. Those Z-scores are visualized as color-coded maps.
According to Dr. Trish, the purpose of a brain map is not to label someone, but to answer a more practical question:
Where is this brain working too hard, and where is it not working hard enough?
The first thing to understand: overactivation and underactivation
When Dr. Leigh introduces brain maps, she always starts in the same place.
Warm colors show overactivation.
Cool colors show underactivation.
That’s the foundation.
But red does not mean “bad”, and blue does not mean “broken.” It means too much or too little of a specific brain speed in a specific place, at that moment.
She often jokes that a fully green brain map is a unicorn.
“I’ve never seen one. Most of us are a little stressed and a little tired.”
So instead of chasing the goal of perfection, Dr. Leigh suggests our goal should be regulation.
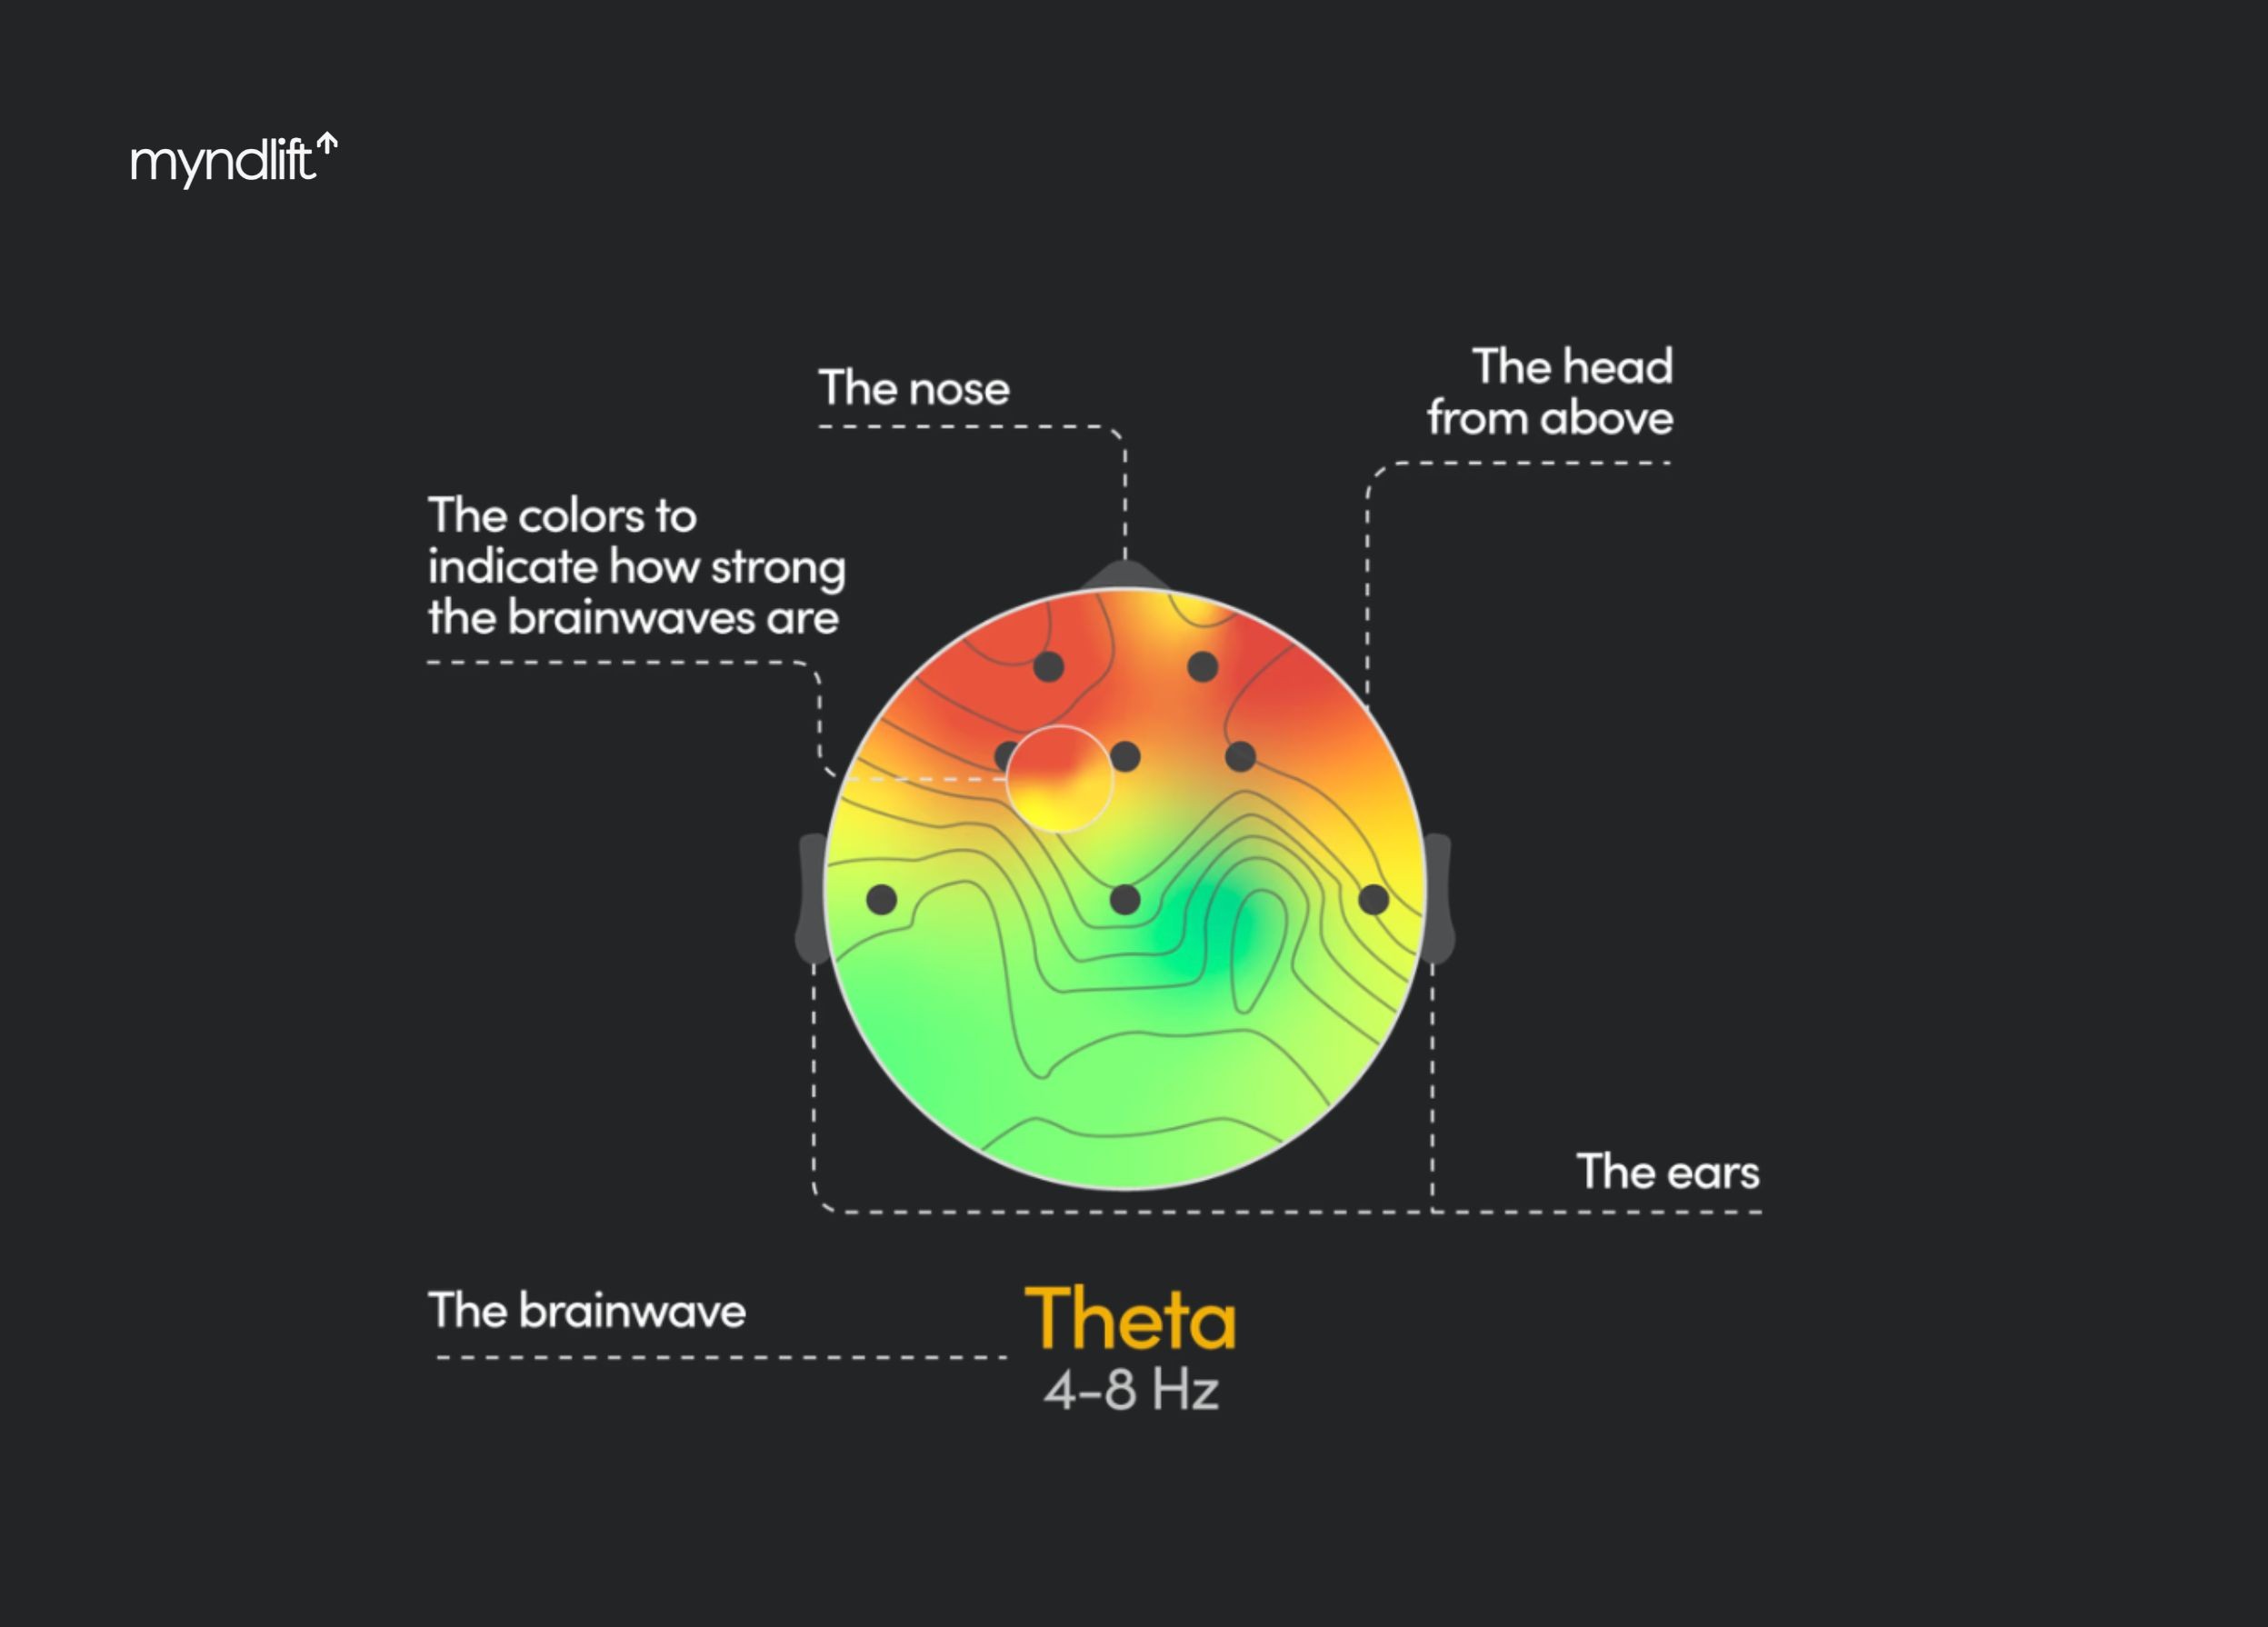
Orientation matters more than you think
Before Dr. Leigh explains anything else, she makes sure people understand what they’re looking at.
She tells clients:
“The triangle pointing up is your nose.”
That simple explanation prevents confusion later. The top of the map is the frontal lobe.
The bottom is the back of the brain.
Left and right correspond to the brain’s hemispheres.
Why patterns matter more than spots
According to Dr. Leigh, one of the most common mistakes beginners make is zooming in too close.
They fixate on a single red patch or a single blue area and try to explain everything from that one detail. Dr. Leigh actively teaches people not to do that.
She looks for patterns instead.
Is the dysregulation focal, regional, or global?
Is it symmetrical or lateralized?
Does it change between eyes open and eyes closed?
Does it make sense given the person’s history?
“The map is a snapshot. The story comes from the person’s life.”
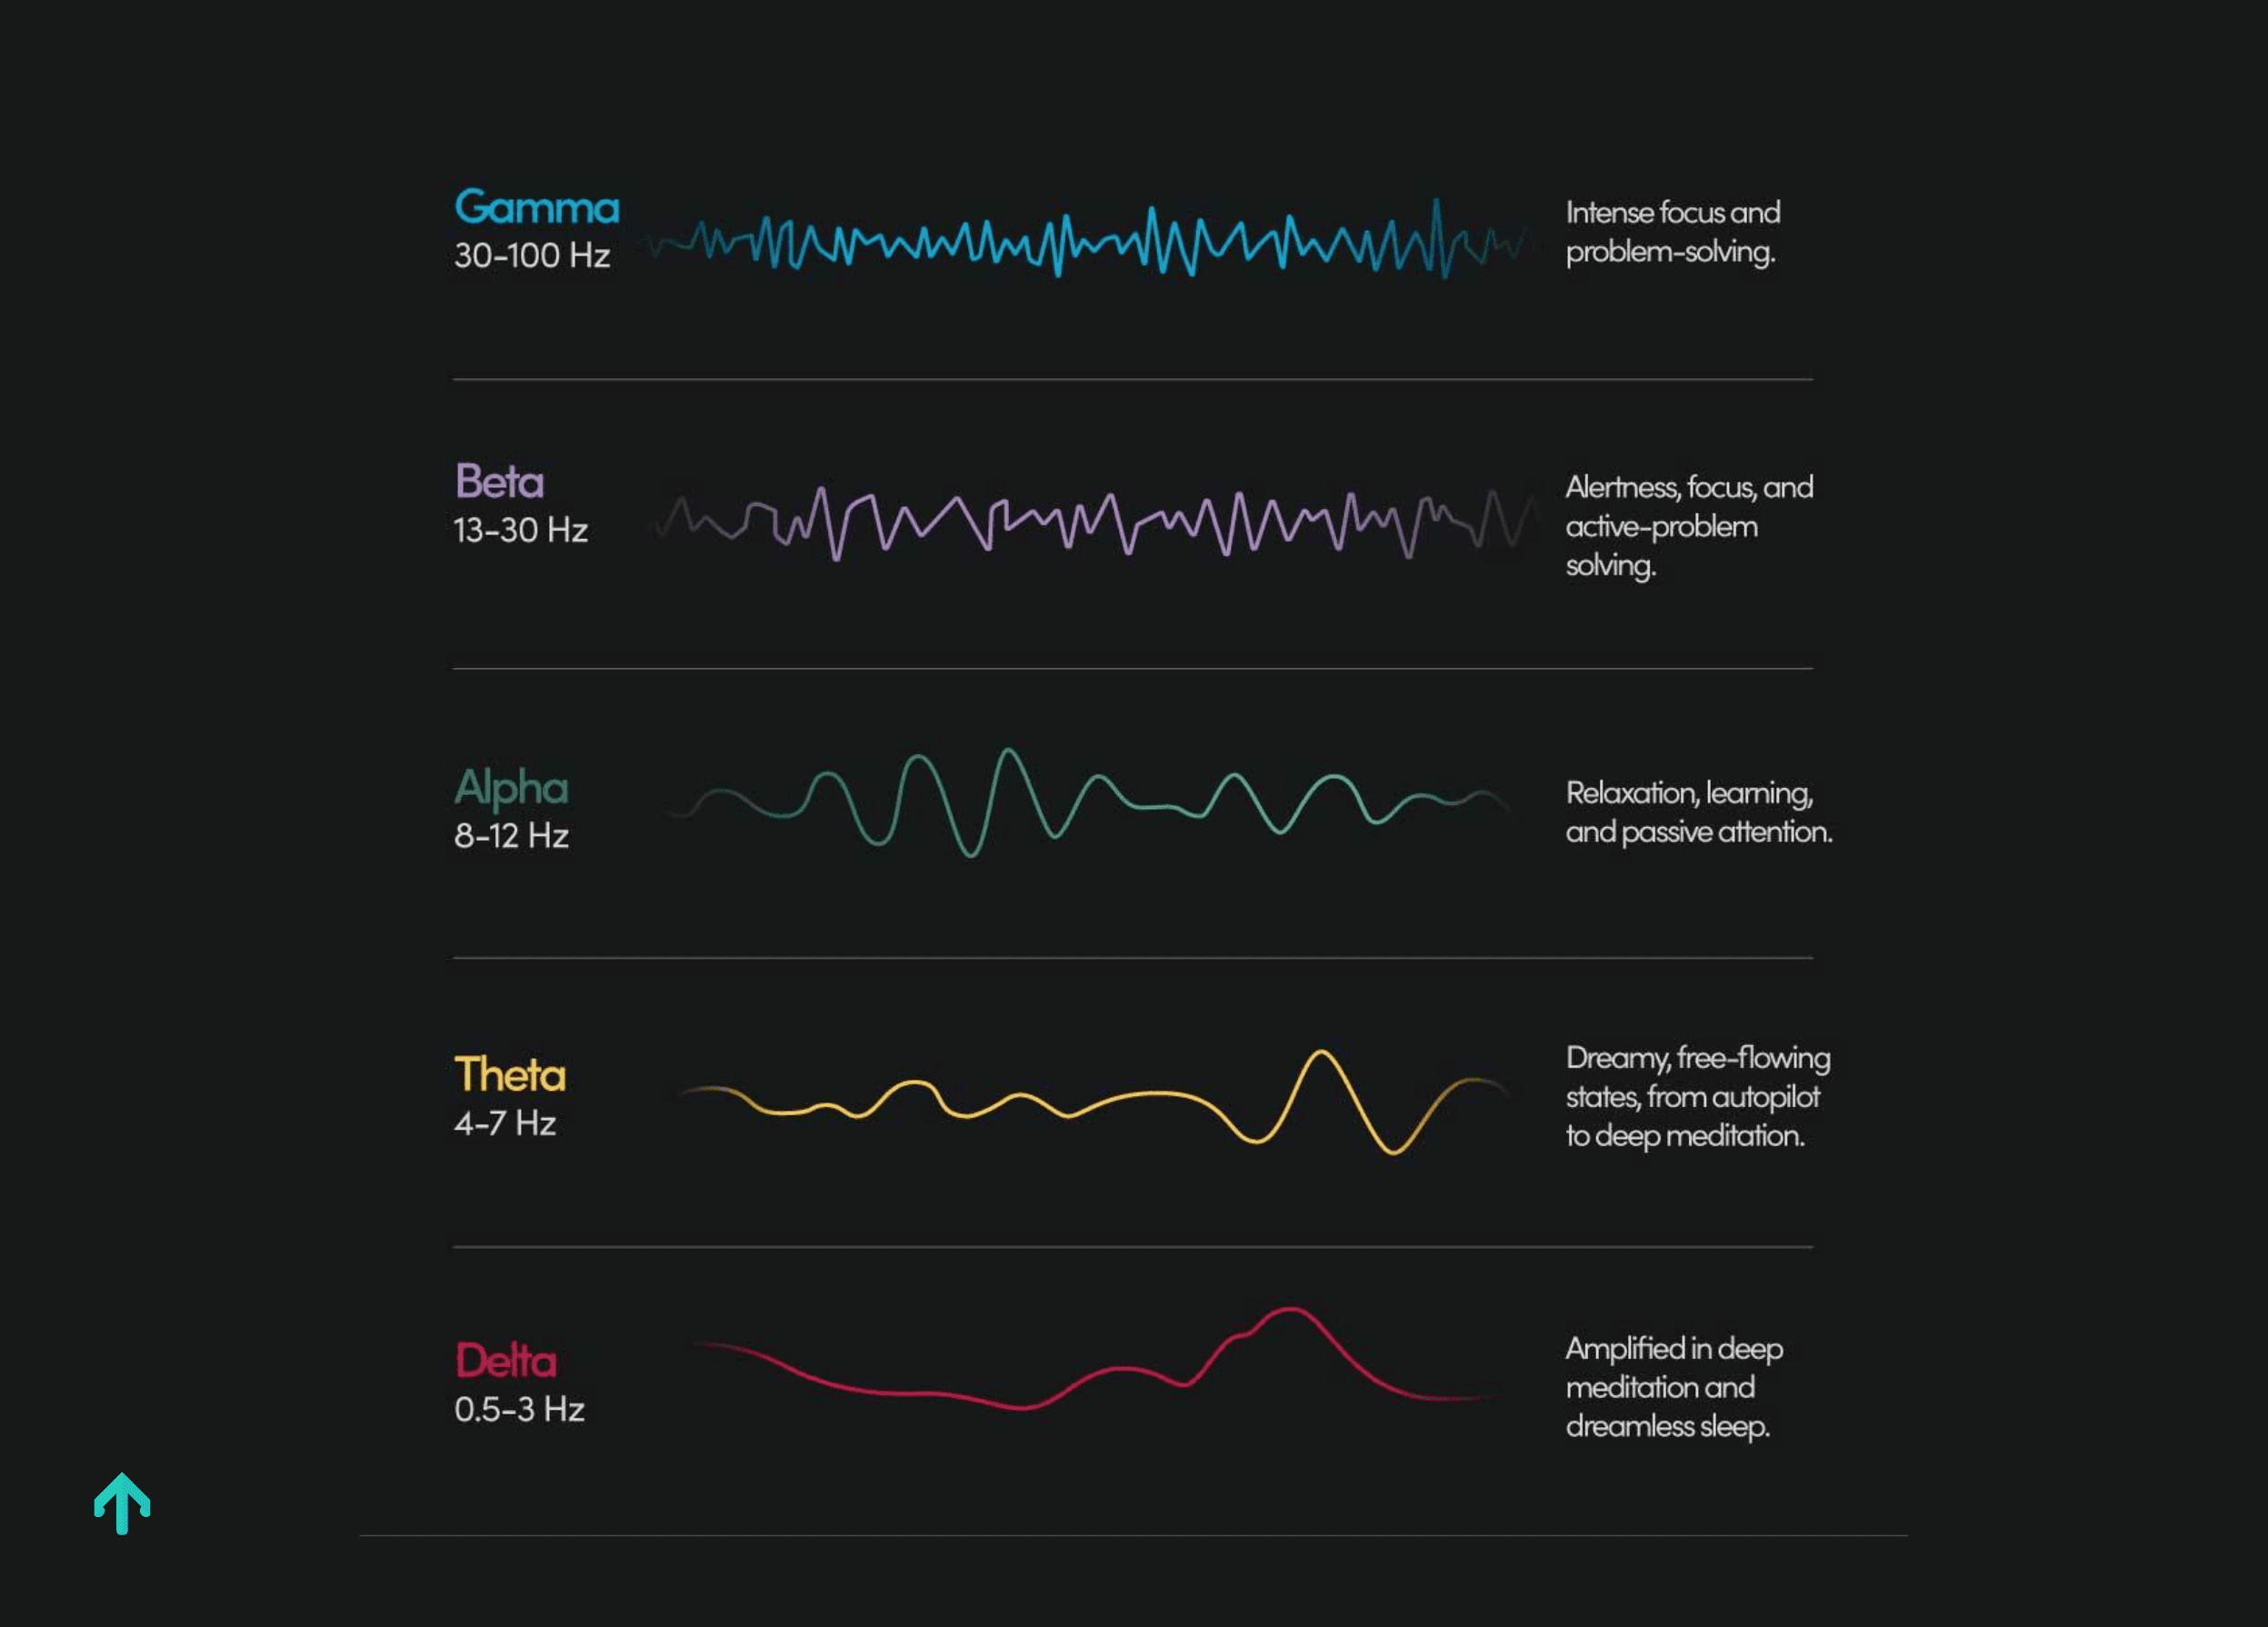
Thinking in brain speeds, not brainwaves
Dr. Leigh prefers to describe frequencies as brain speeds, because it makes their function intuitive.
At the top of the map are the slowest speeds.
At the bottom are the fastest, with delta being the slowest, and high beta being the fastest.
Dr. Leigh explains that each speed has a purpose, but problems arise when the brain uses the right speed at the wrong time:
Delta (0.5-3 Hz) is the stay-asleep mode. You want it when you’re sleeping. You don’t want it dominating during the day.
Theta (4-7 Hz) is the fall-asleep mode. It’s useful for creativity and memory, but too much of it during waking hours can interfere with focus.
Alpha sits in the middle (8.12 Hz). It’s neutral. Calm. Integration. The ability to sit on the couch and relax. You want to be able to access it, but not get stuck there.
Beta and high beta are the fastest speeds (13-30 Hz). They are linked to intense thinking, focus, and stress responses. But when high beta takes over, the brain struggles to shut off.
Gamma (30-100 Hz) is the fastest brain speed. It’s linked to complex processing and integration, but is interpreted carefully on brain maps and always alongside other frequencies.
Reading an anxiety brain map
Anxiety is the most common pattern Dr. Leigh sees, largely shaped by the pace and pressures of everyday life.
On an anxiety map, she typically sees excess beta and high beta, often concentrated in the frontal lobes.
That matters because the frontal lobes are where executive function lives. Planning. Judgment. Working memory. Impulse control. Organization.
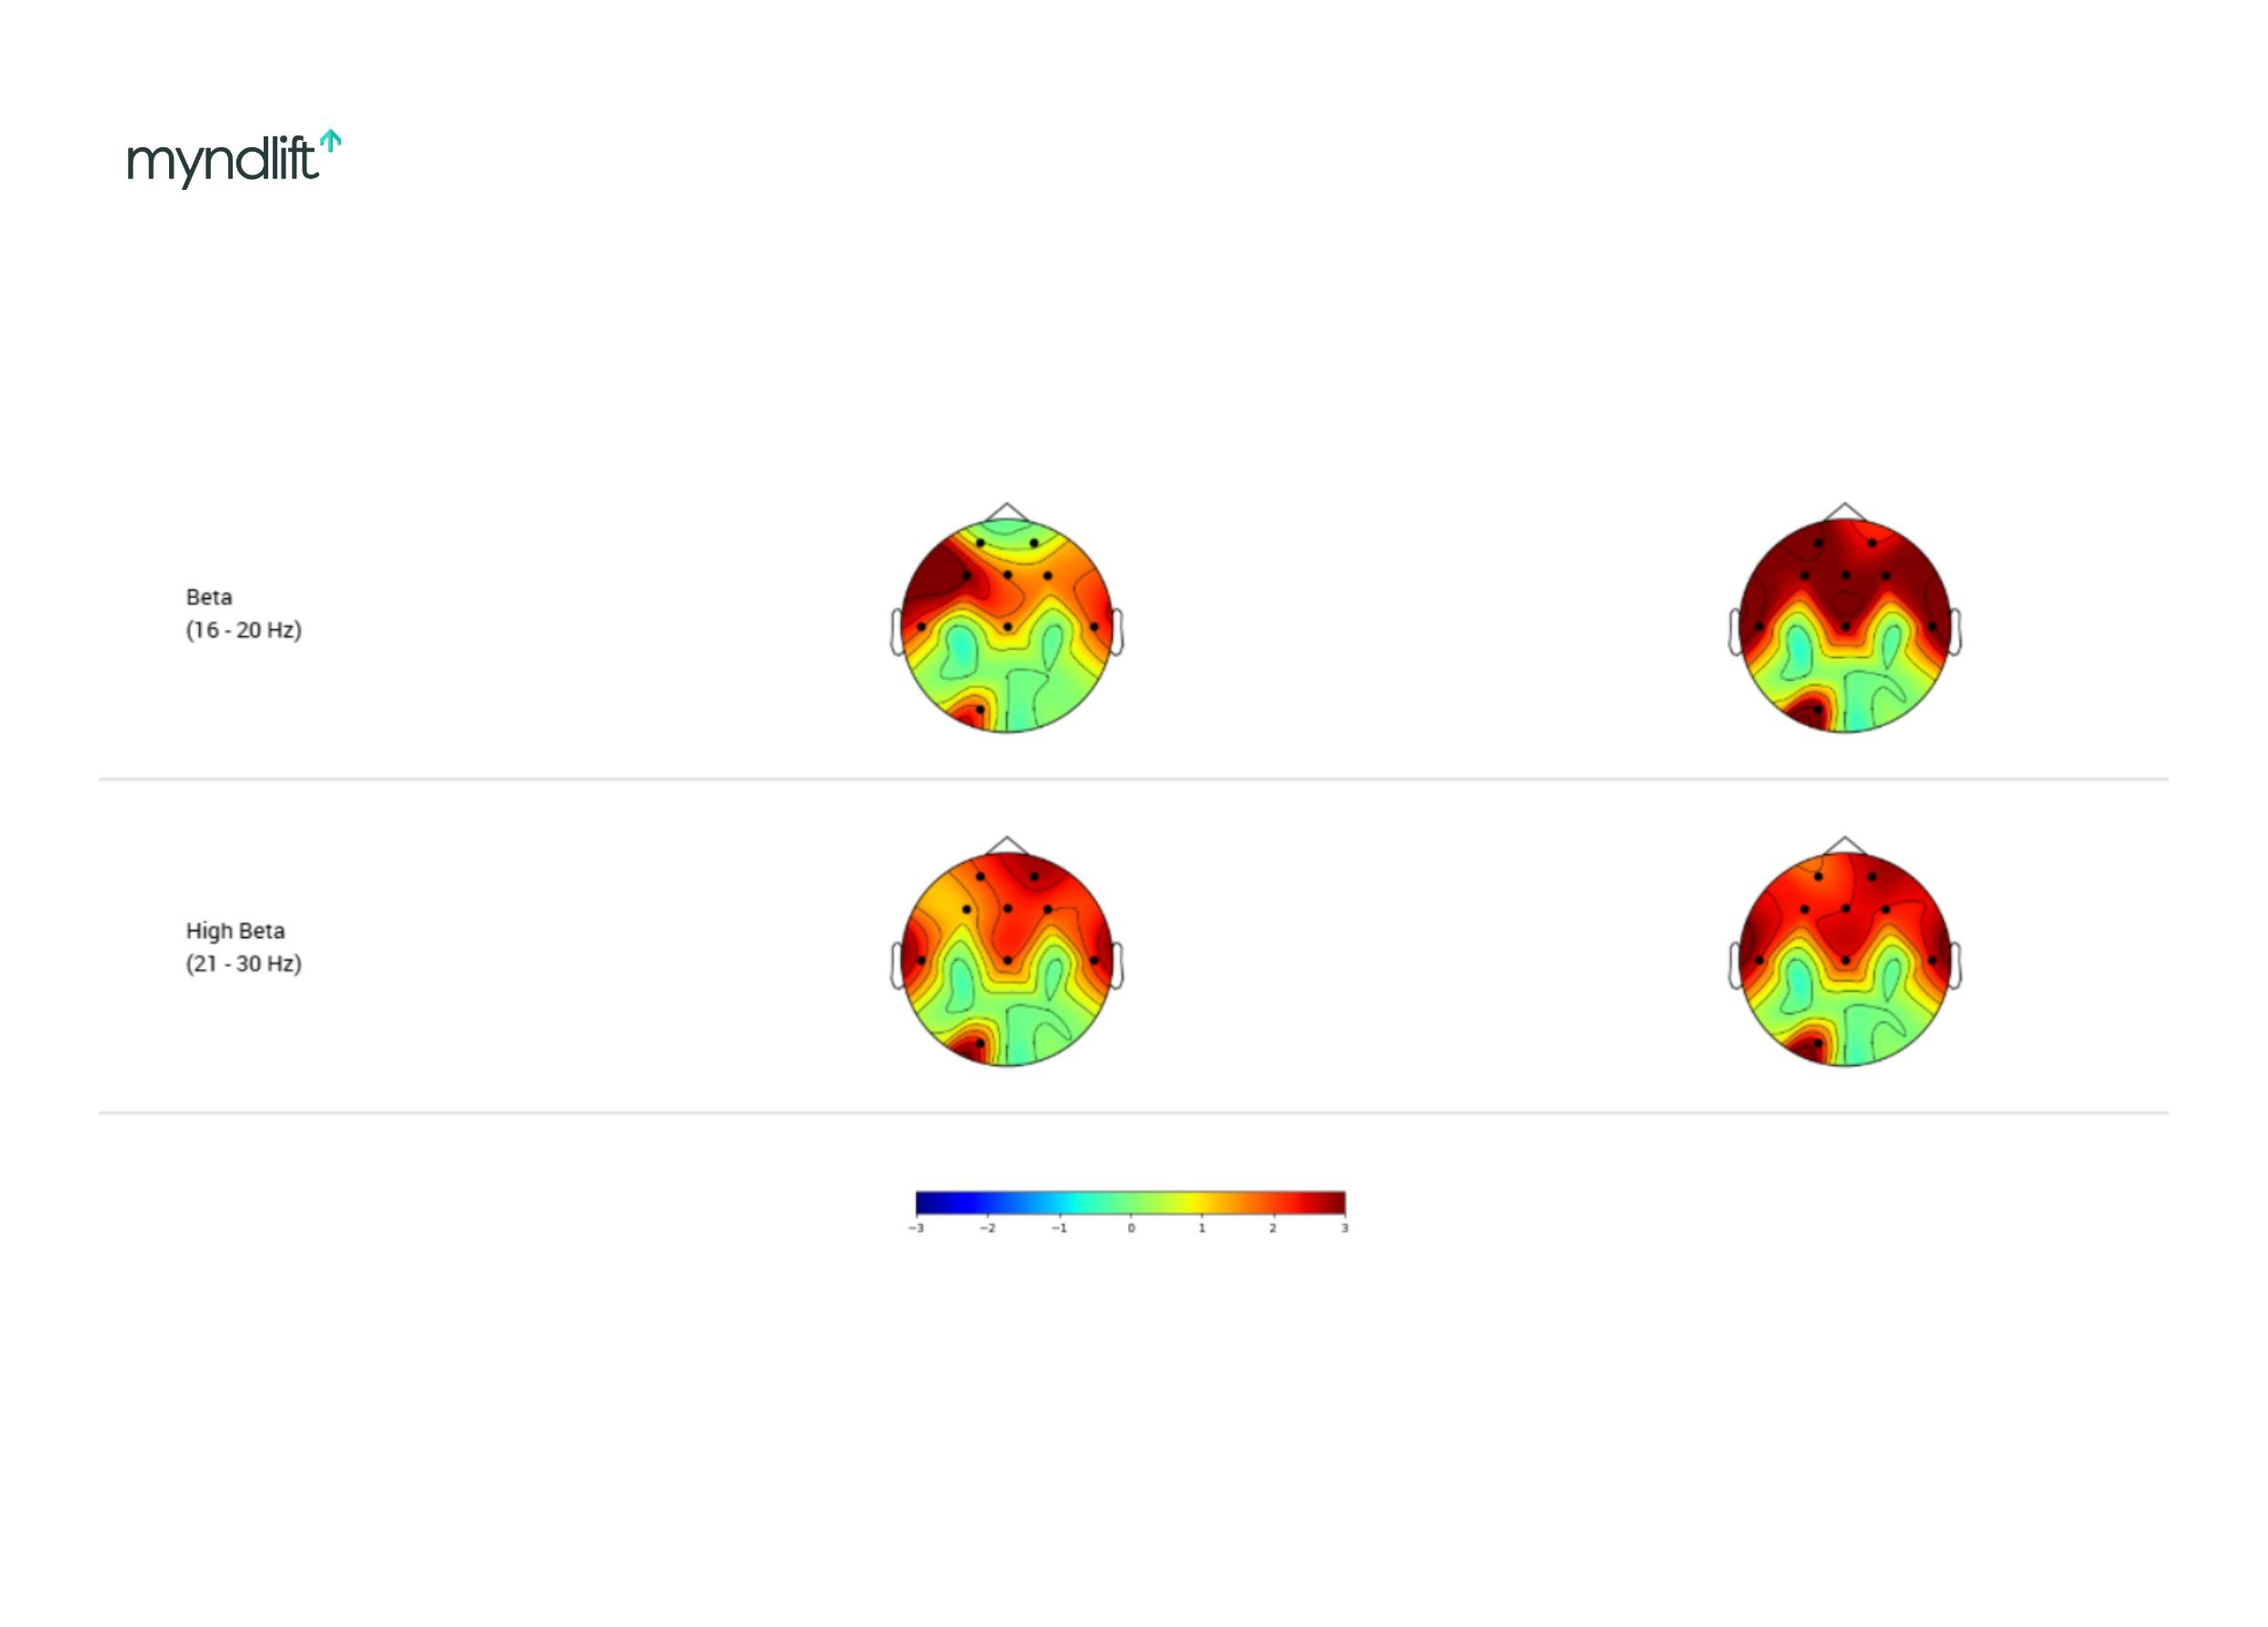
These brain maps come from Dr. Trish Leigh’s clinical work and show common beta and high-beta patterns associated with anxiety.
When high beta dominates here, the brain can stay in fight-or-flight. As Dr. Leigh explains, “It becomes problem-seeking instead of problem-solving.”
People with this pattern often struggle to sleep, their thoughts race, they ruminate, they feel vigilant or hypervigilant, and always on red alert.
She describes it as a fire in the brain. The map looks red because the brain is burning too fast.
How anxiety training is guided by the map
Dr. Leigh is very clear about this: she bases training on the brain map, not just symptoms.
“We have too much data to be symptom-based.”
When she sees frontal high beta, that’s where she targets training. She inhibits those fast speeds and supports calmer rhythms, especially alpha.
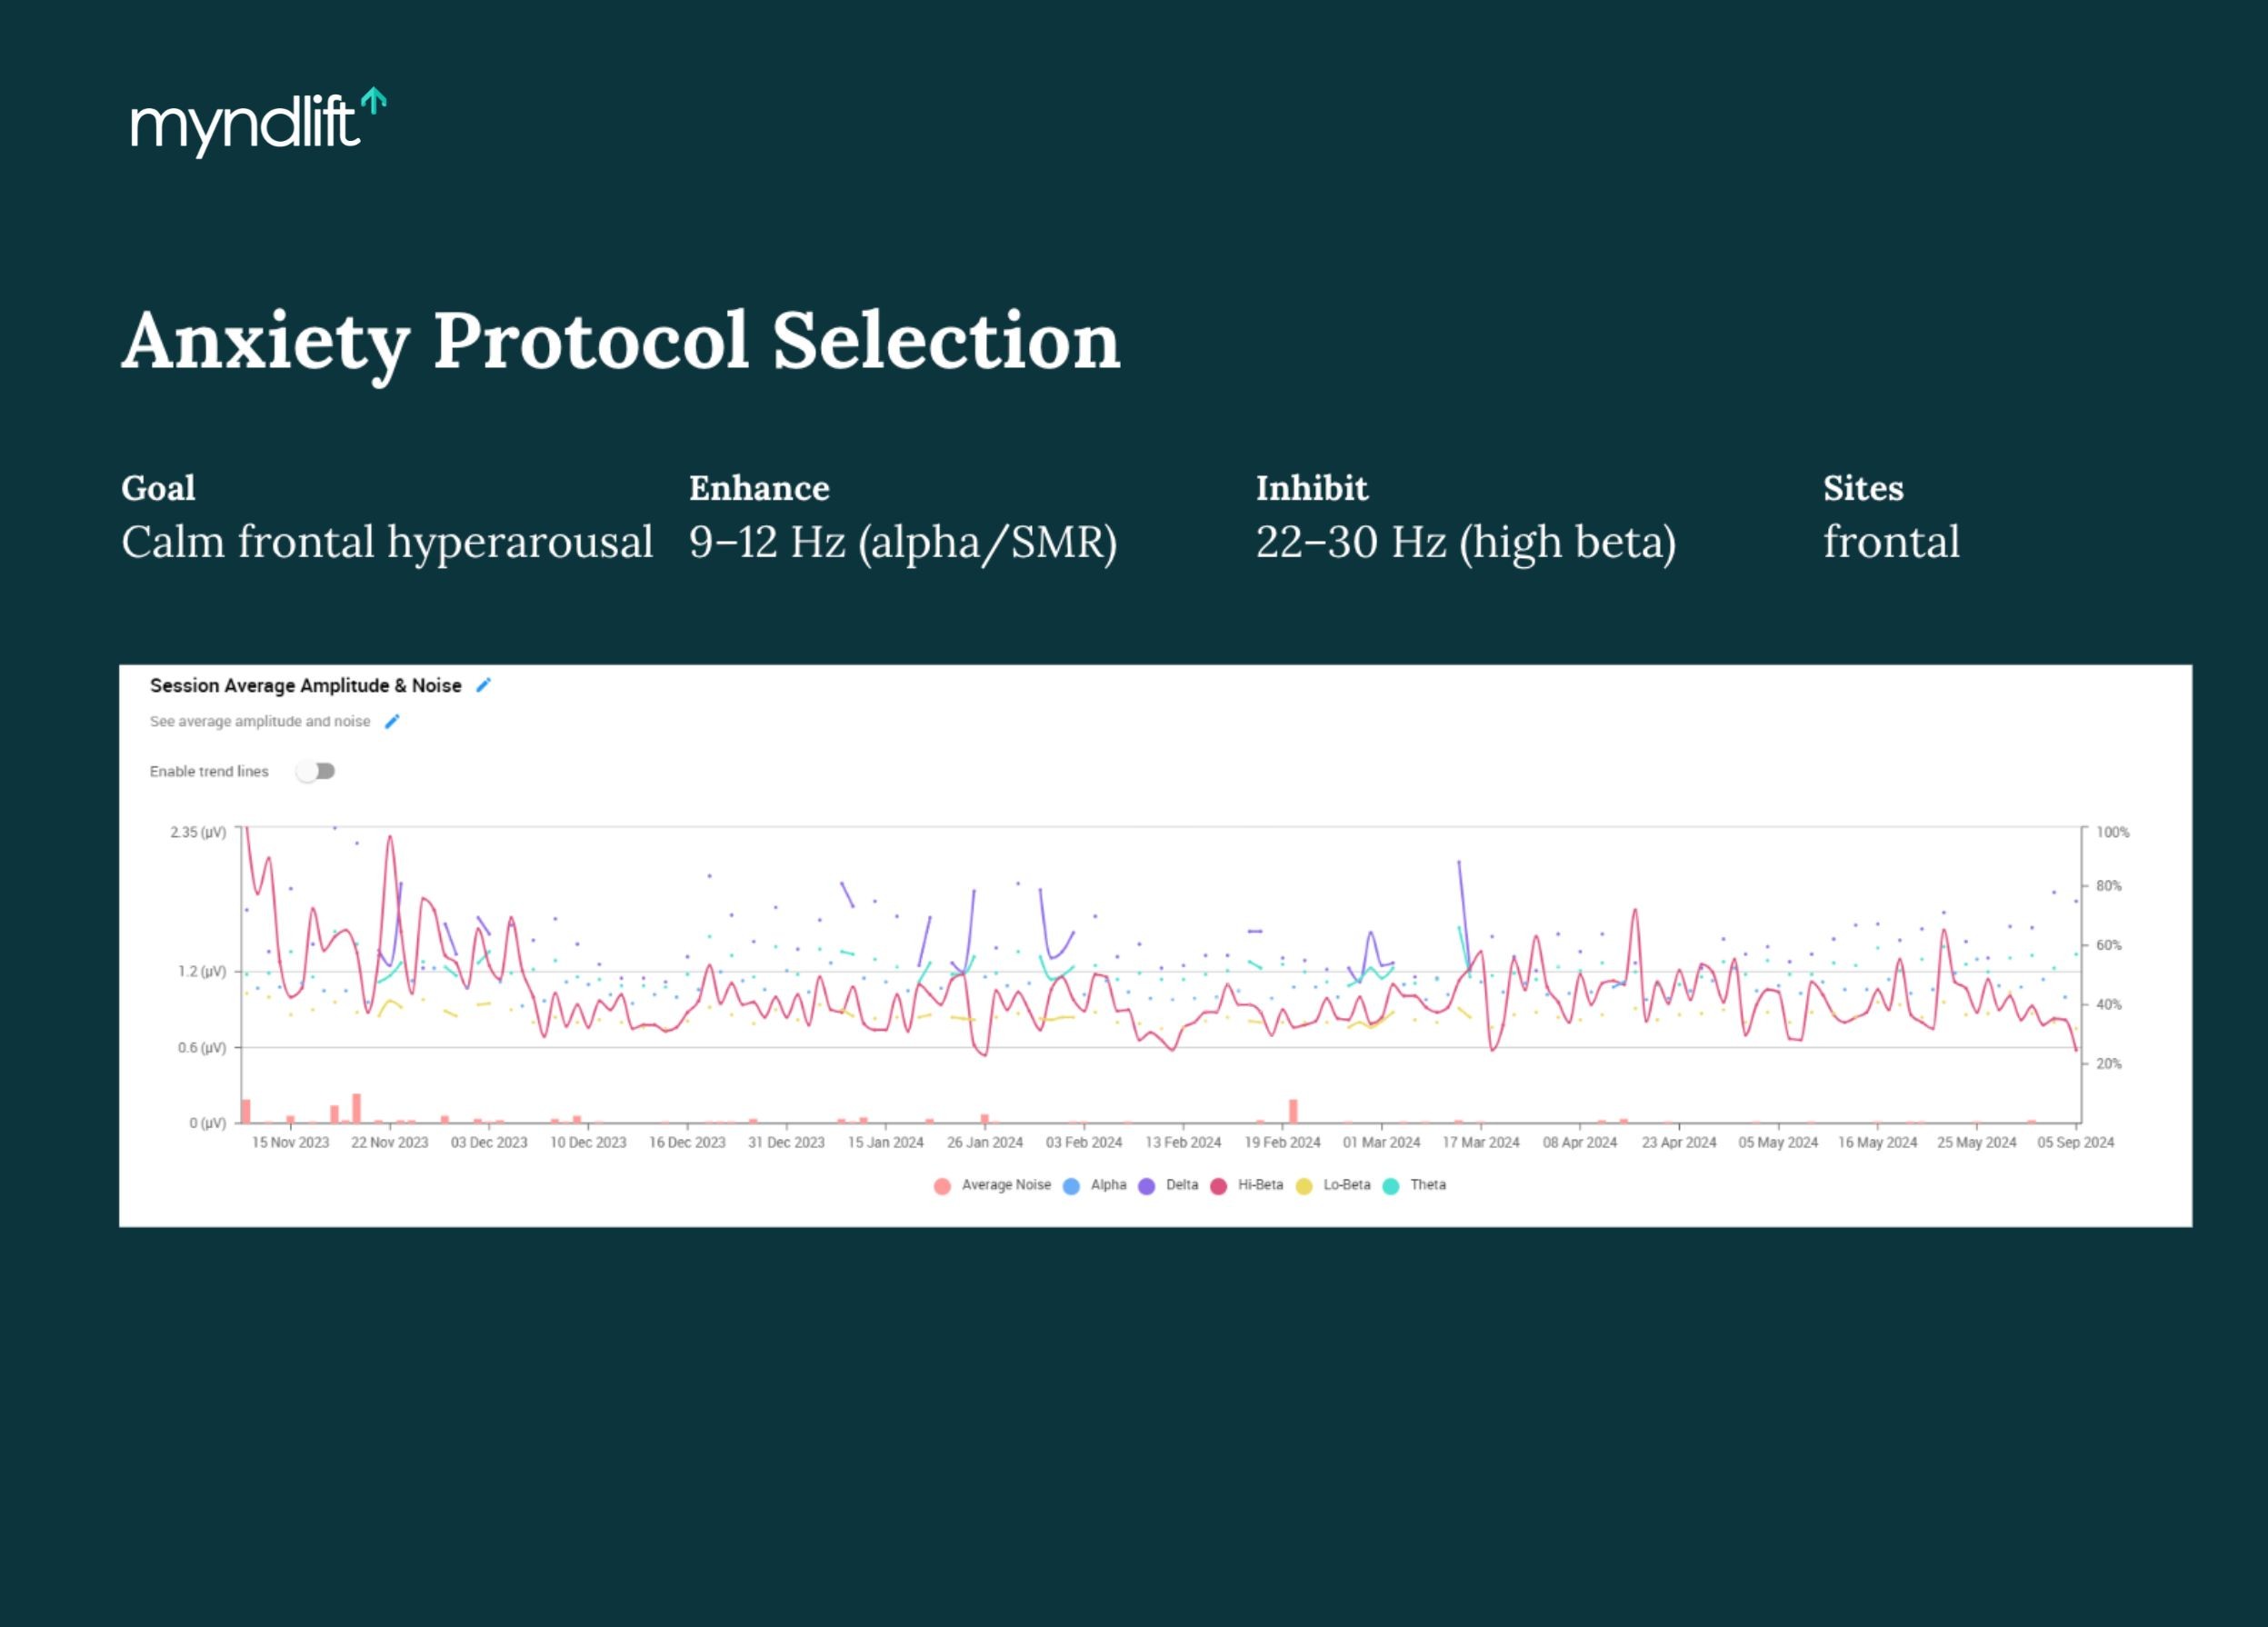
Progress data from Dr. Trish Leigh’s clinical work, displayed in the Myndlift platform to monitor regulation over time.
Over time, she tracks progress using trend graphs. One client she described started with extremely elevated high beta. Within a month, the graph showed a dramatic drop.
That doesn’t mean life became stress-free, but that the brain recovered faster.
“That’s what regulation is”, explains Dr. Leigh.
Reading an ADHD brain map
ADHD, in Dr. Leigh’s words, is a hypo-aroused brain. There is too much slowing during waking hours.
Delta and theta are elevated. Beta and alpha are often low. The brain has too much braking and not enough acceleration.
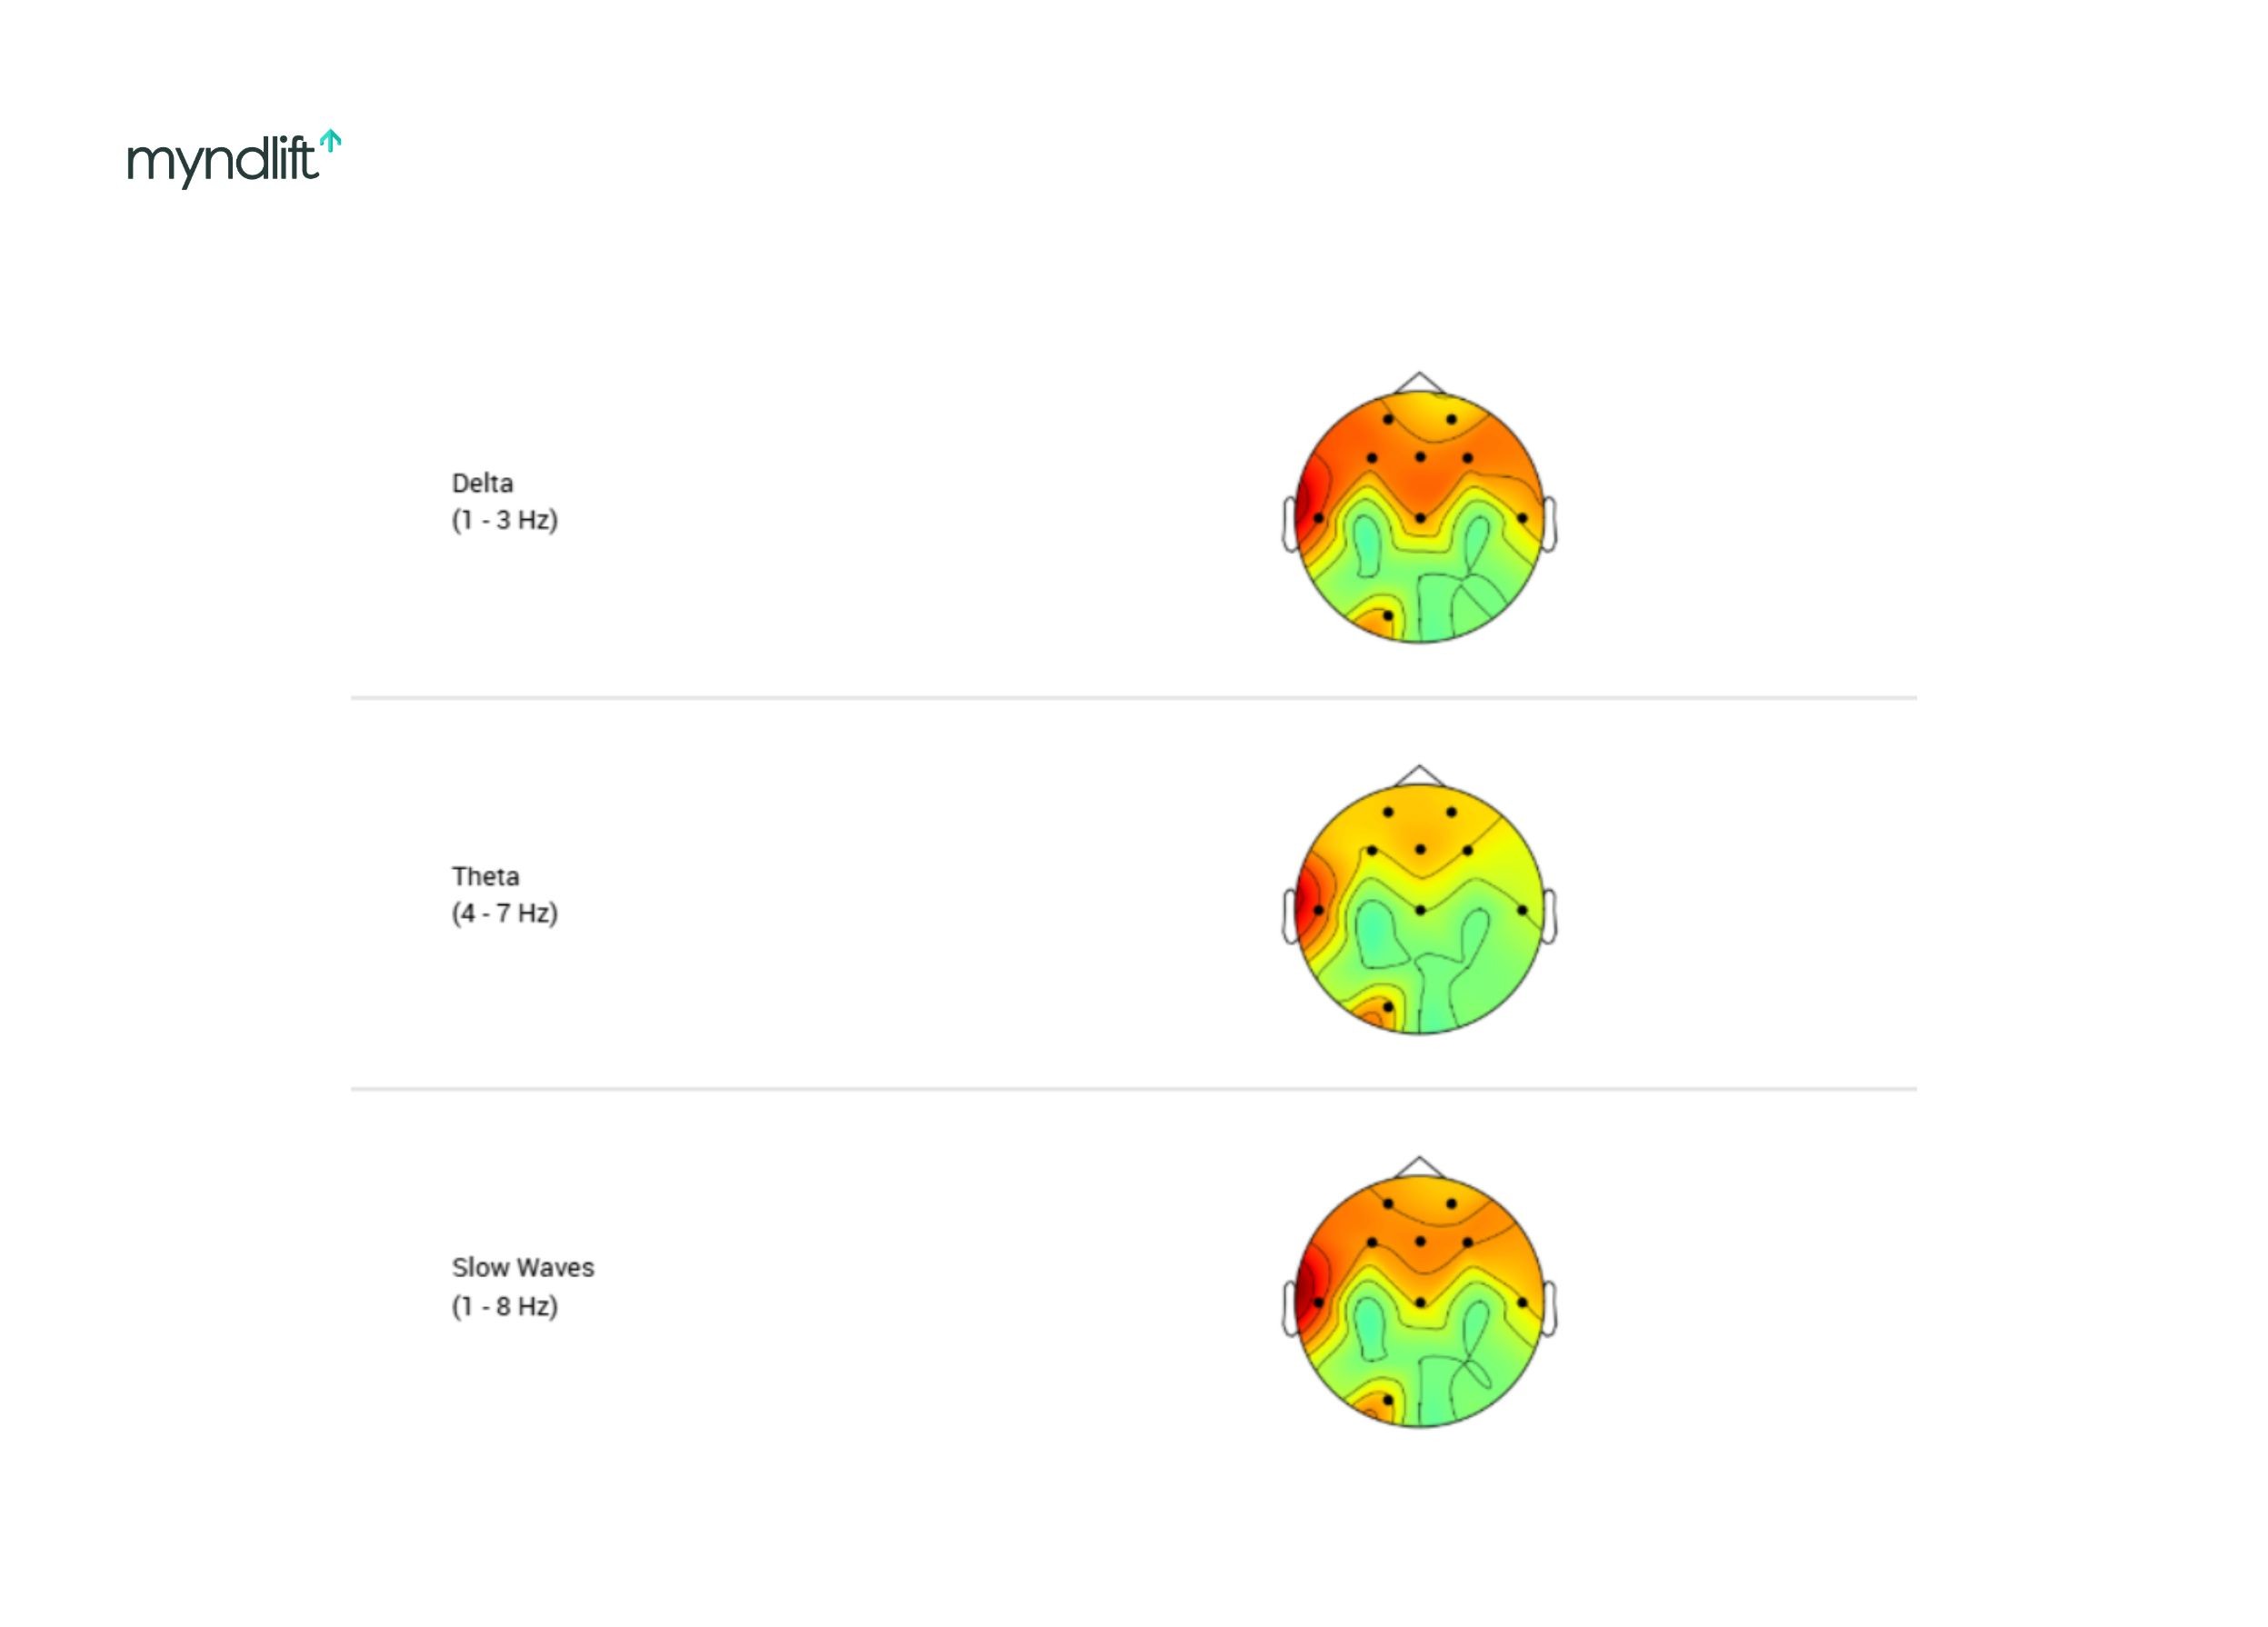
Myndlift brain maps from Dr. Trish Leigh’s ADHD cases, illustrating why slow-wave color is easy to misinterpret.
This is where color can be misinterpreted.
Red in delta or theta does not mean too much slowness.
“You don’t want the brakes on during the day.”
As Dr. Leigh explains, when the brain is over-slowed, people compensate. They move their bodies, they fidget, they worry, and they stimulate themselves mentally or physically to stay awake.
According to Dr. Leigh, hyperactivity is not the core problem. It’s the workaround.
Tracking ADHD progress over time
In ADHD cases, Dr. Leigh pays close attention to trend graphs and noise bars.
High noise means the brain is struggling to regulate. As training progresses, noise decreases. Theta comes down. The brain becomes more efficient.
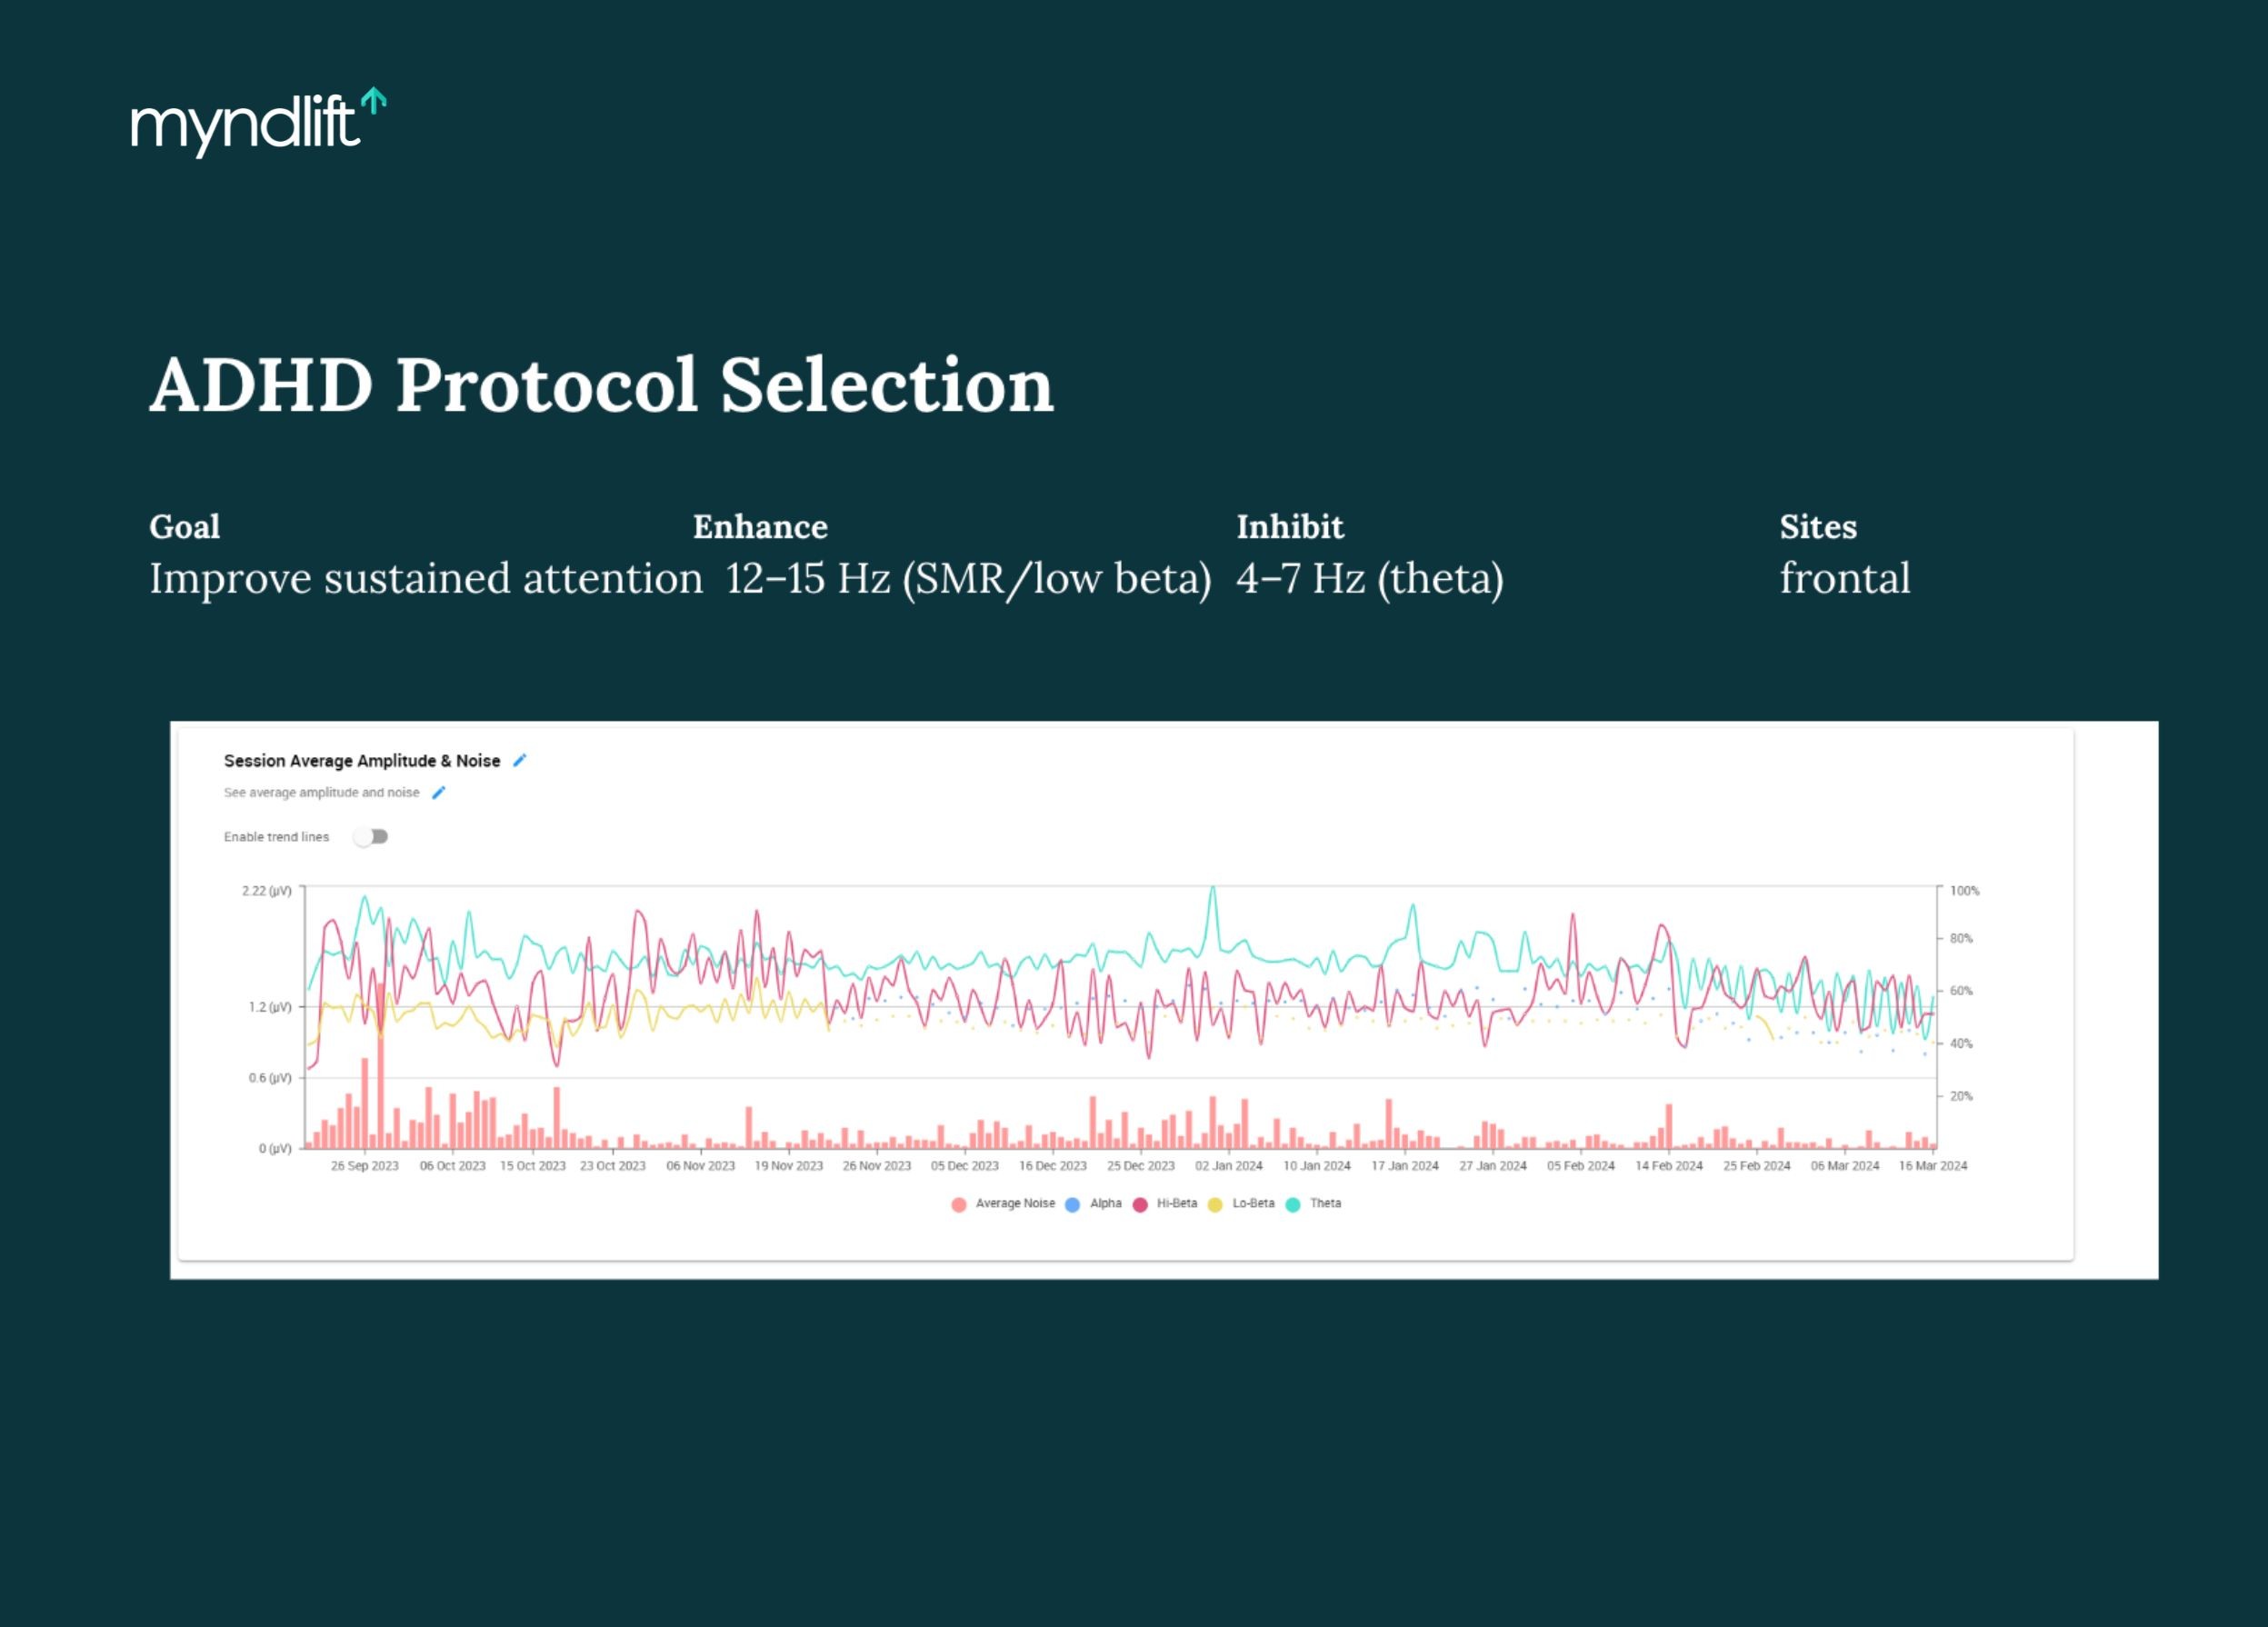
Progress data from Dr. Trish Leigh’s clinical work, displayed in the Myndlift platform to monitor regulation over time.
She also emphasizes that ADHD and anxiety are often comorbid. As one pattern improves, another may become more visible. Protocols change accordingly.
“I want to get the brain moving as fast as I can because once someone feels better, everything else follows.”
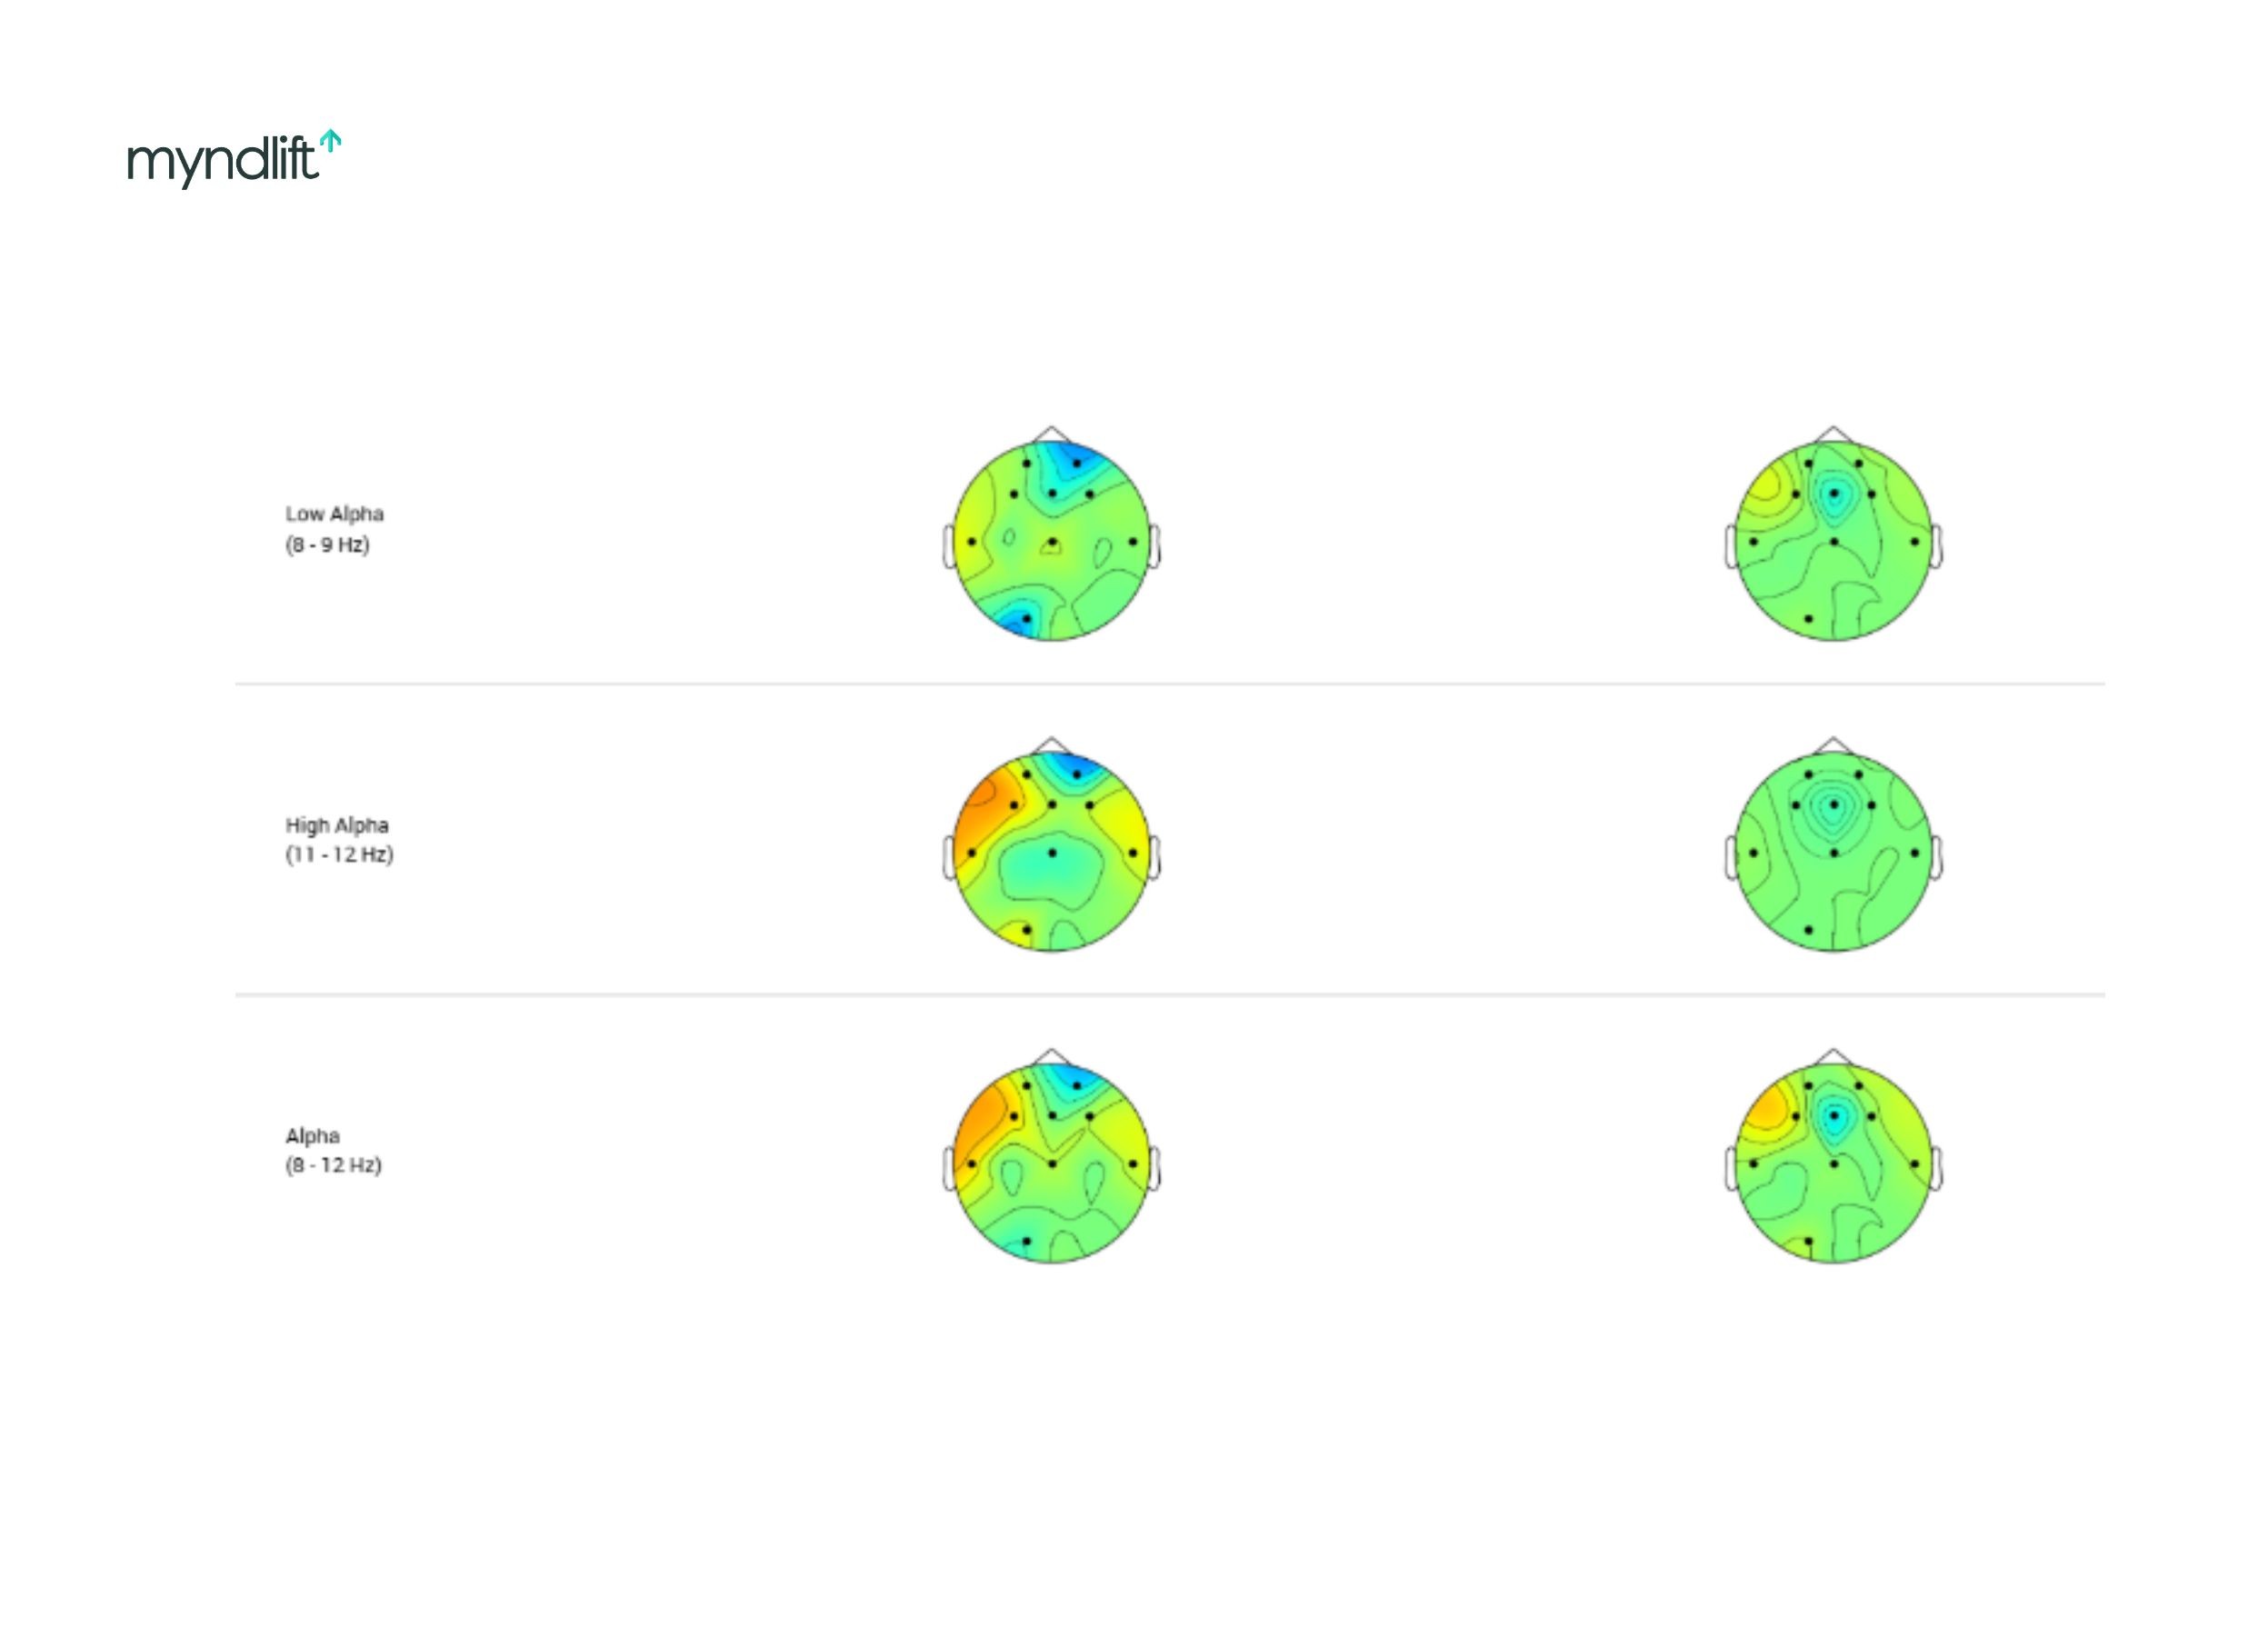
Reading a depression brain map
Depression often lives in the middle speeds, with alpha brainwaves being the key players.
On many depression maps, Dr. Leigh sees excessive alpha, often asymmetrical, especially in the left frontal region. Sometimes it’s combined with elevated delta.
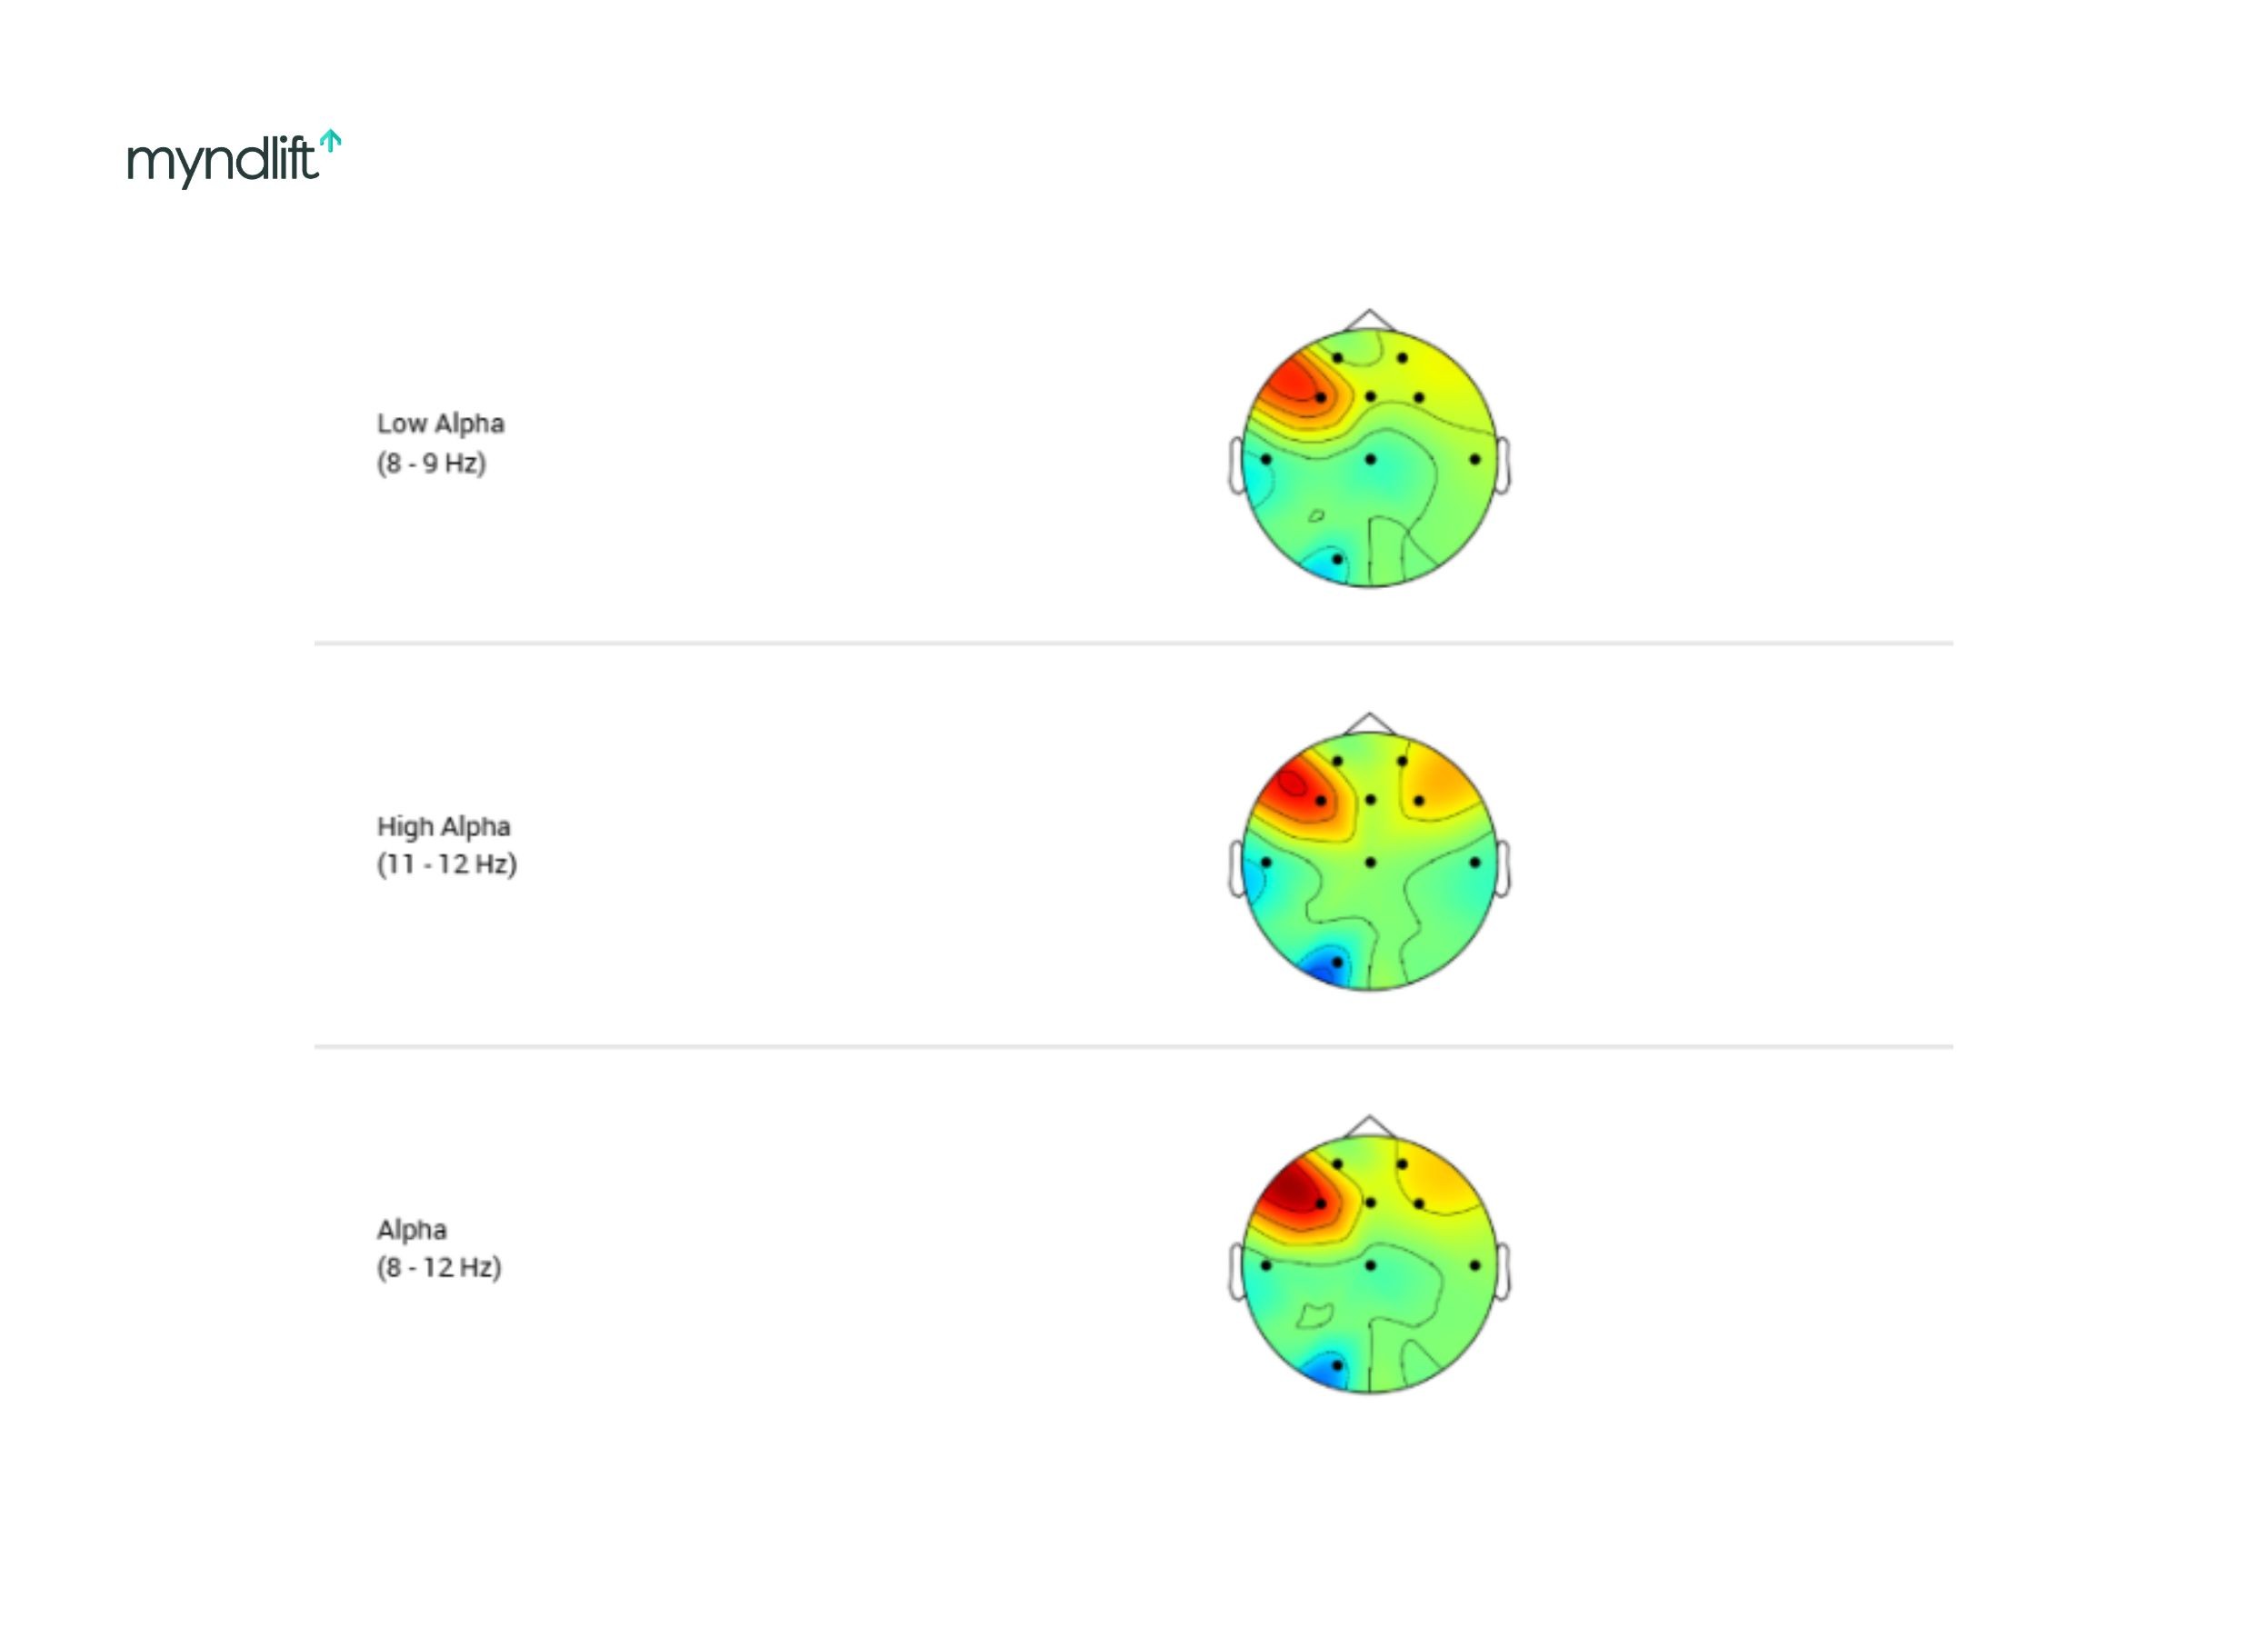
Examples from Dr. Trish Leigh’s clinical cases, viewed in the Myndlift platform, showing alpha-dominant patterns often associated with depression.
She explains depression as a brain stuck in neutral.
“Your get-up-and-go got up and went.”
Some people experience this as low motivation and fatigue. Others experience mood volatility. The map helps distinguish how depression shows up for that individual.
One important marker is alpha response. Specifically, how much alpha increases when the eyes close. In some cases, alpha floods the brain during rest, making it hard to re-engage.
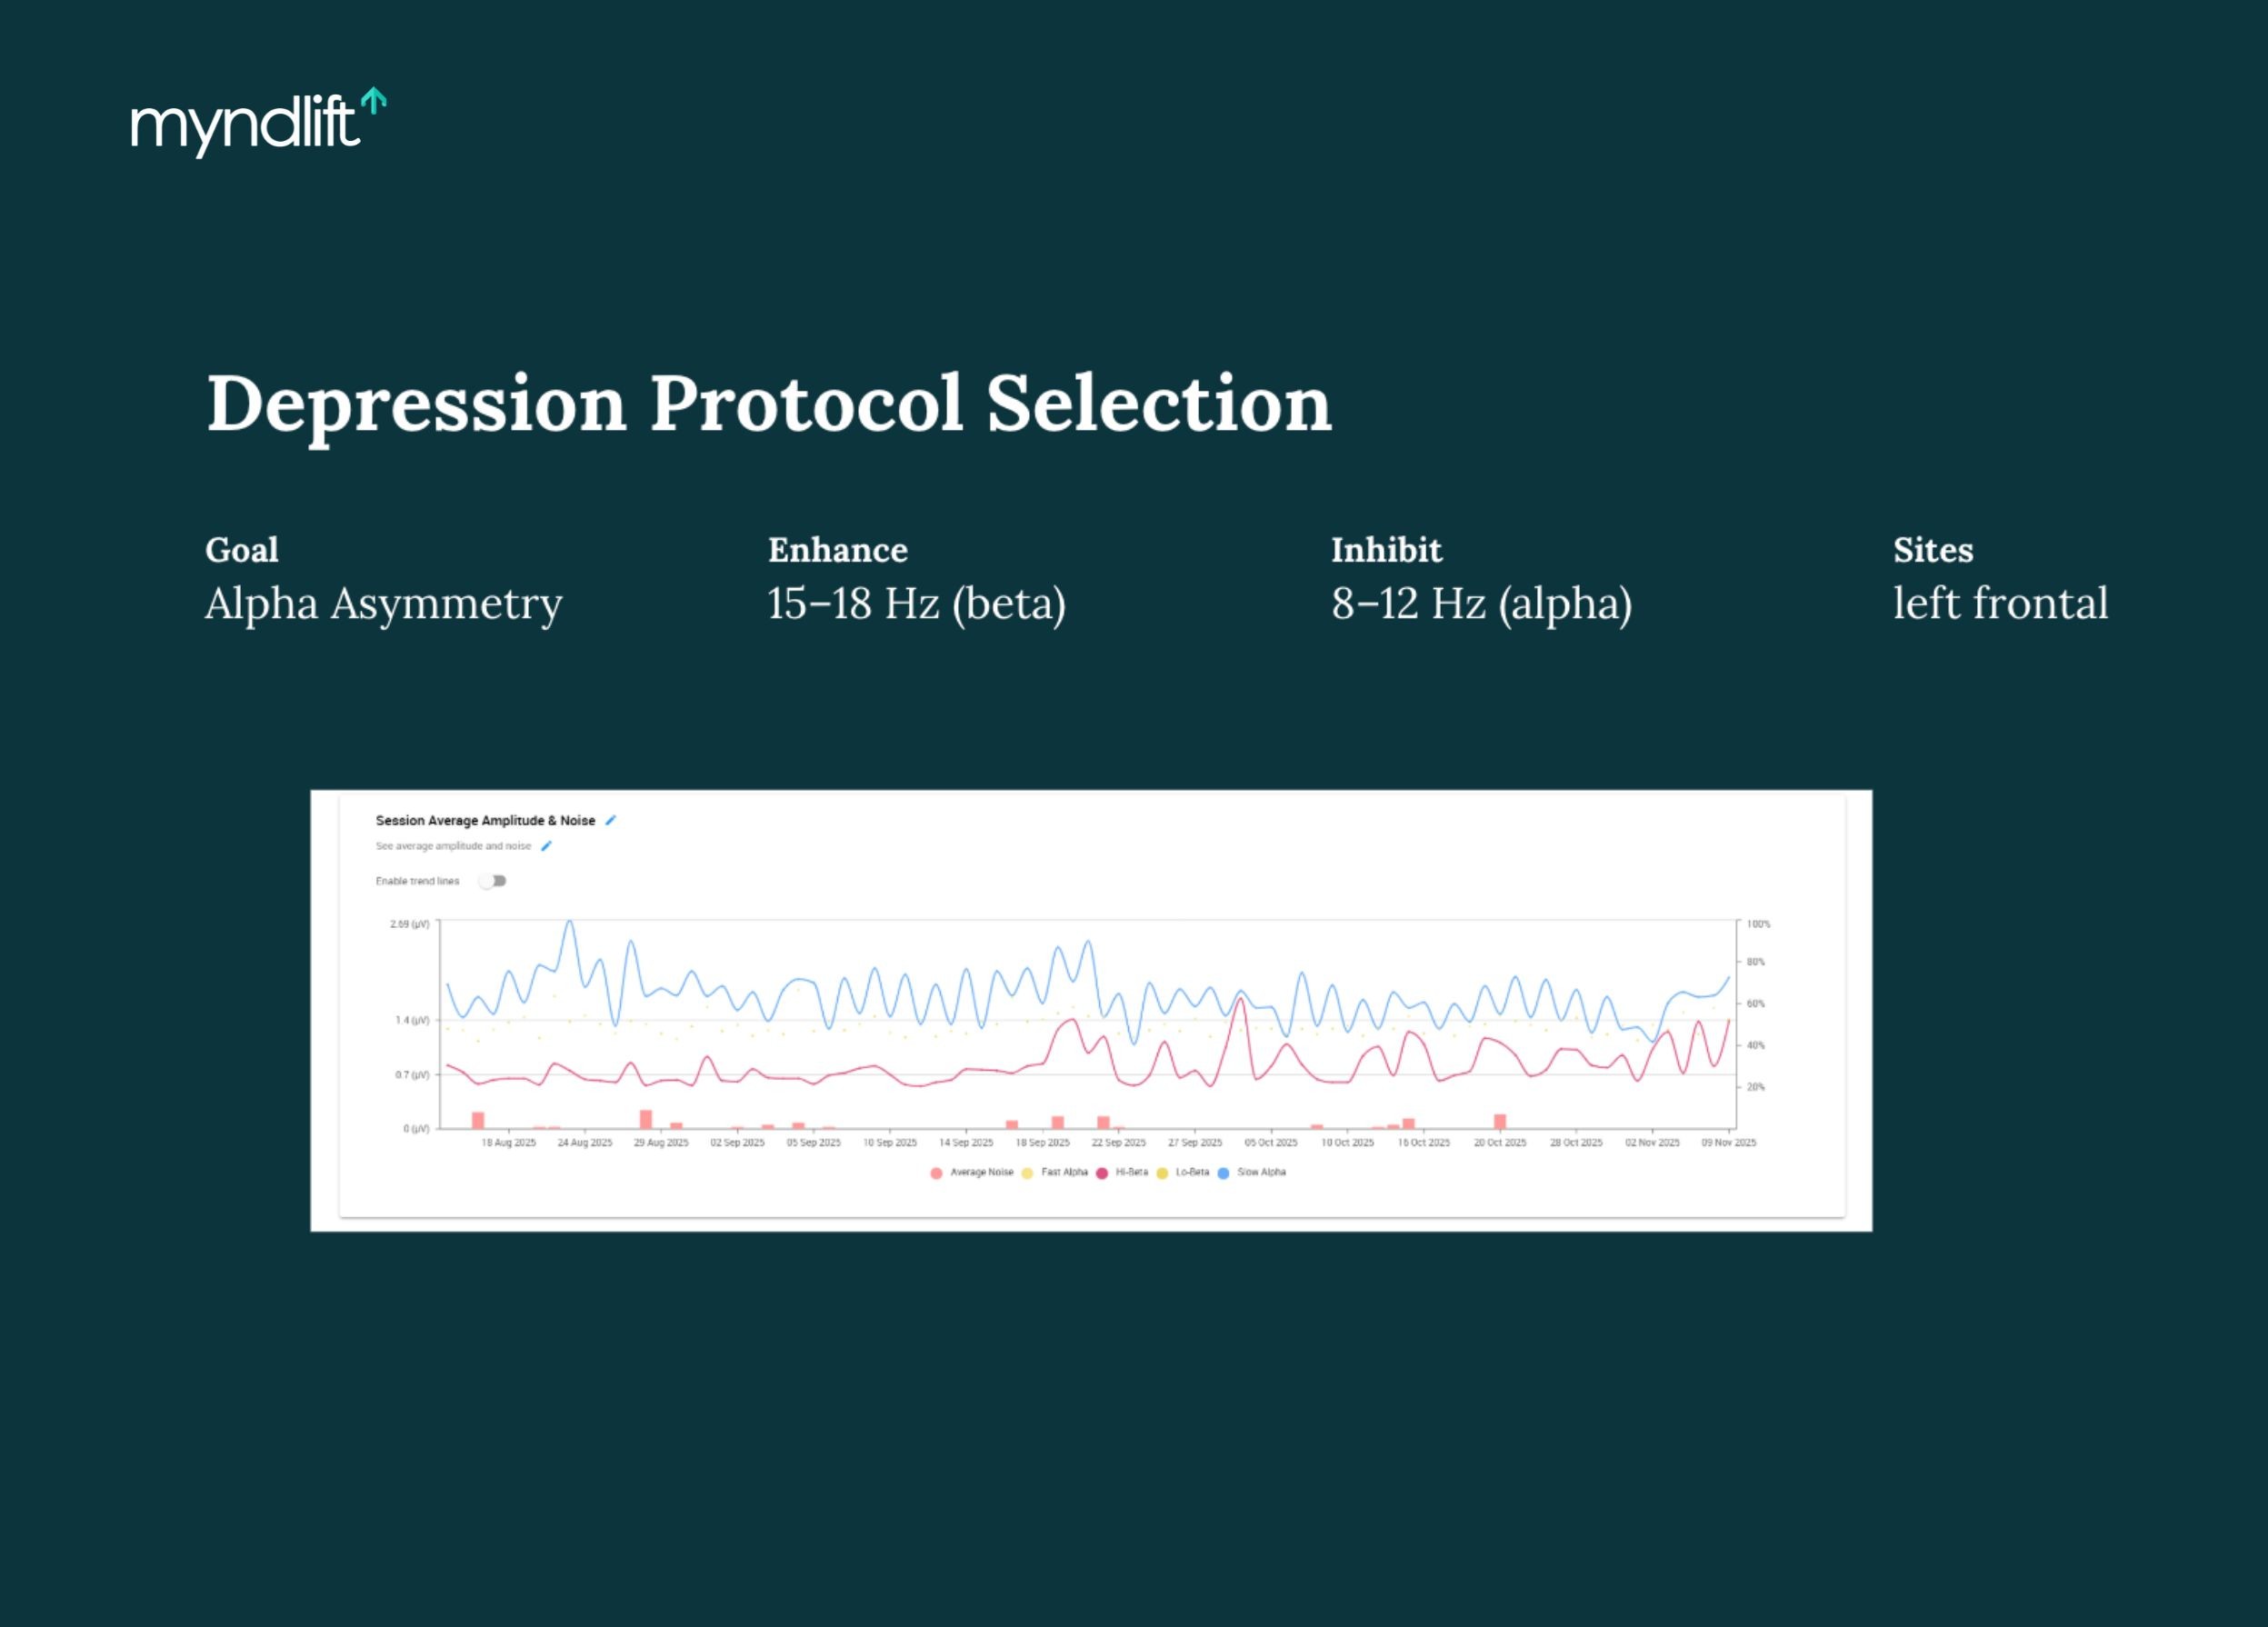
Progress data from Dr. Trish Leigh’s clinical work, displayed in the Myndlift platform to monitor regulation over time.
When maps don’t fit one box
Many brain maps don’t announce themselves clearly.
Instead, Dr. Leigh sees combinations: excess delta in the back of the brain, left-frontal alpha, right-frontal high beta.
This is where interpretation becomes clinical art.
“That’s the differential diagnosis piece. Where do I start first?”
She starts with the person, their symptoms, their priorities, and their life constraints.
Then she designs protocols that can alternate targets, allowing multiple patterns to be addressed without overwhelming the brain.
Not all brain maps fit a single category. These mixed patterns from Dr. Trish Leigh’s clinical cases show why interpretation focuses on context, not labels.
Screen use and alpha response
One of the more advanced patterns Dr. Leigh discussed involves excessive alpha response related to screen use.
She noticed cases where alpha increased by hundreds of percent when eyes closed, which is far beyond normal relaxation.
Over time, she recognized this as a marker of dopamine desensitization from screens, gaming, and explicit content.
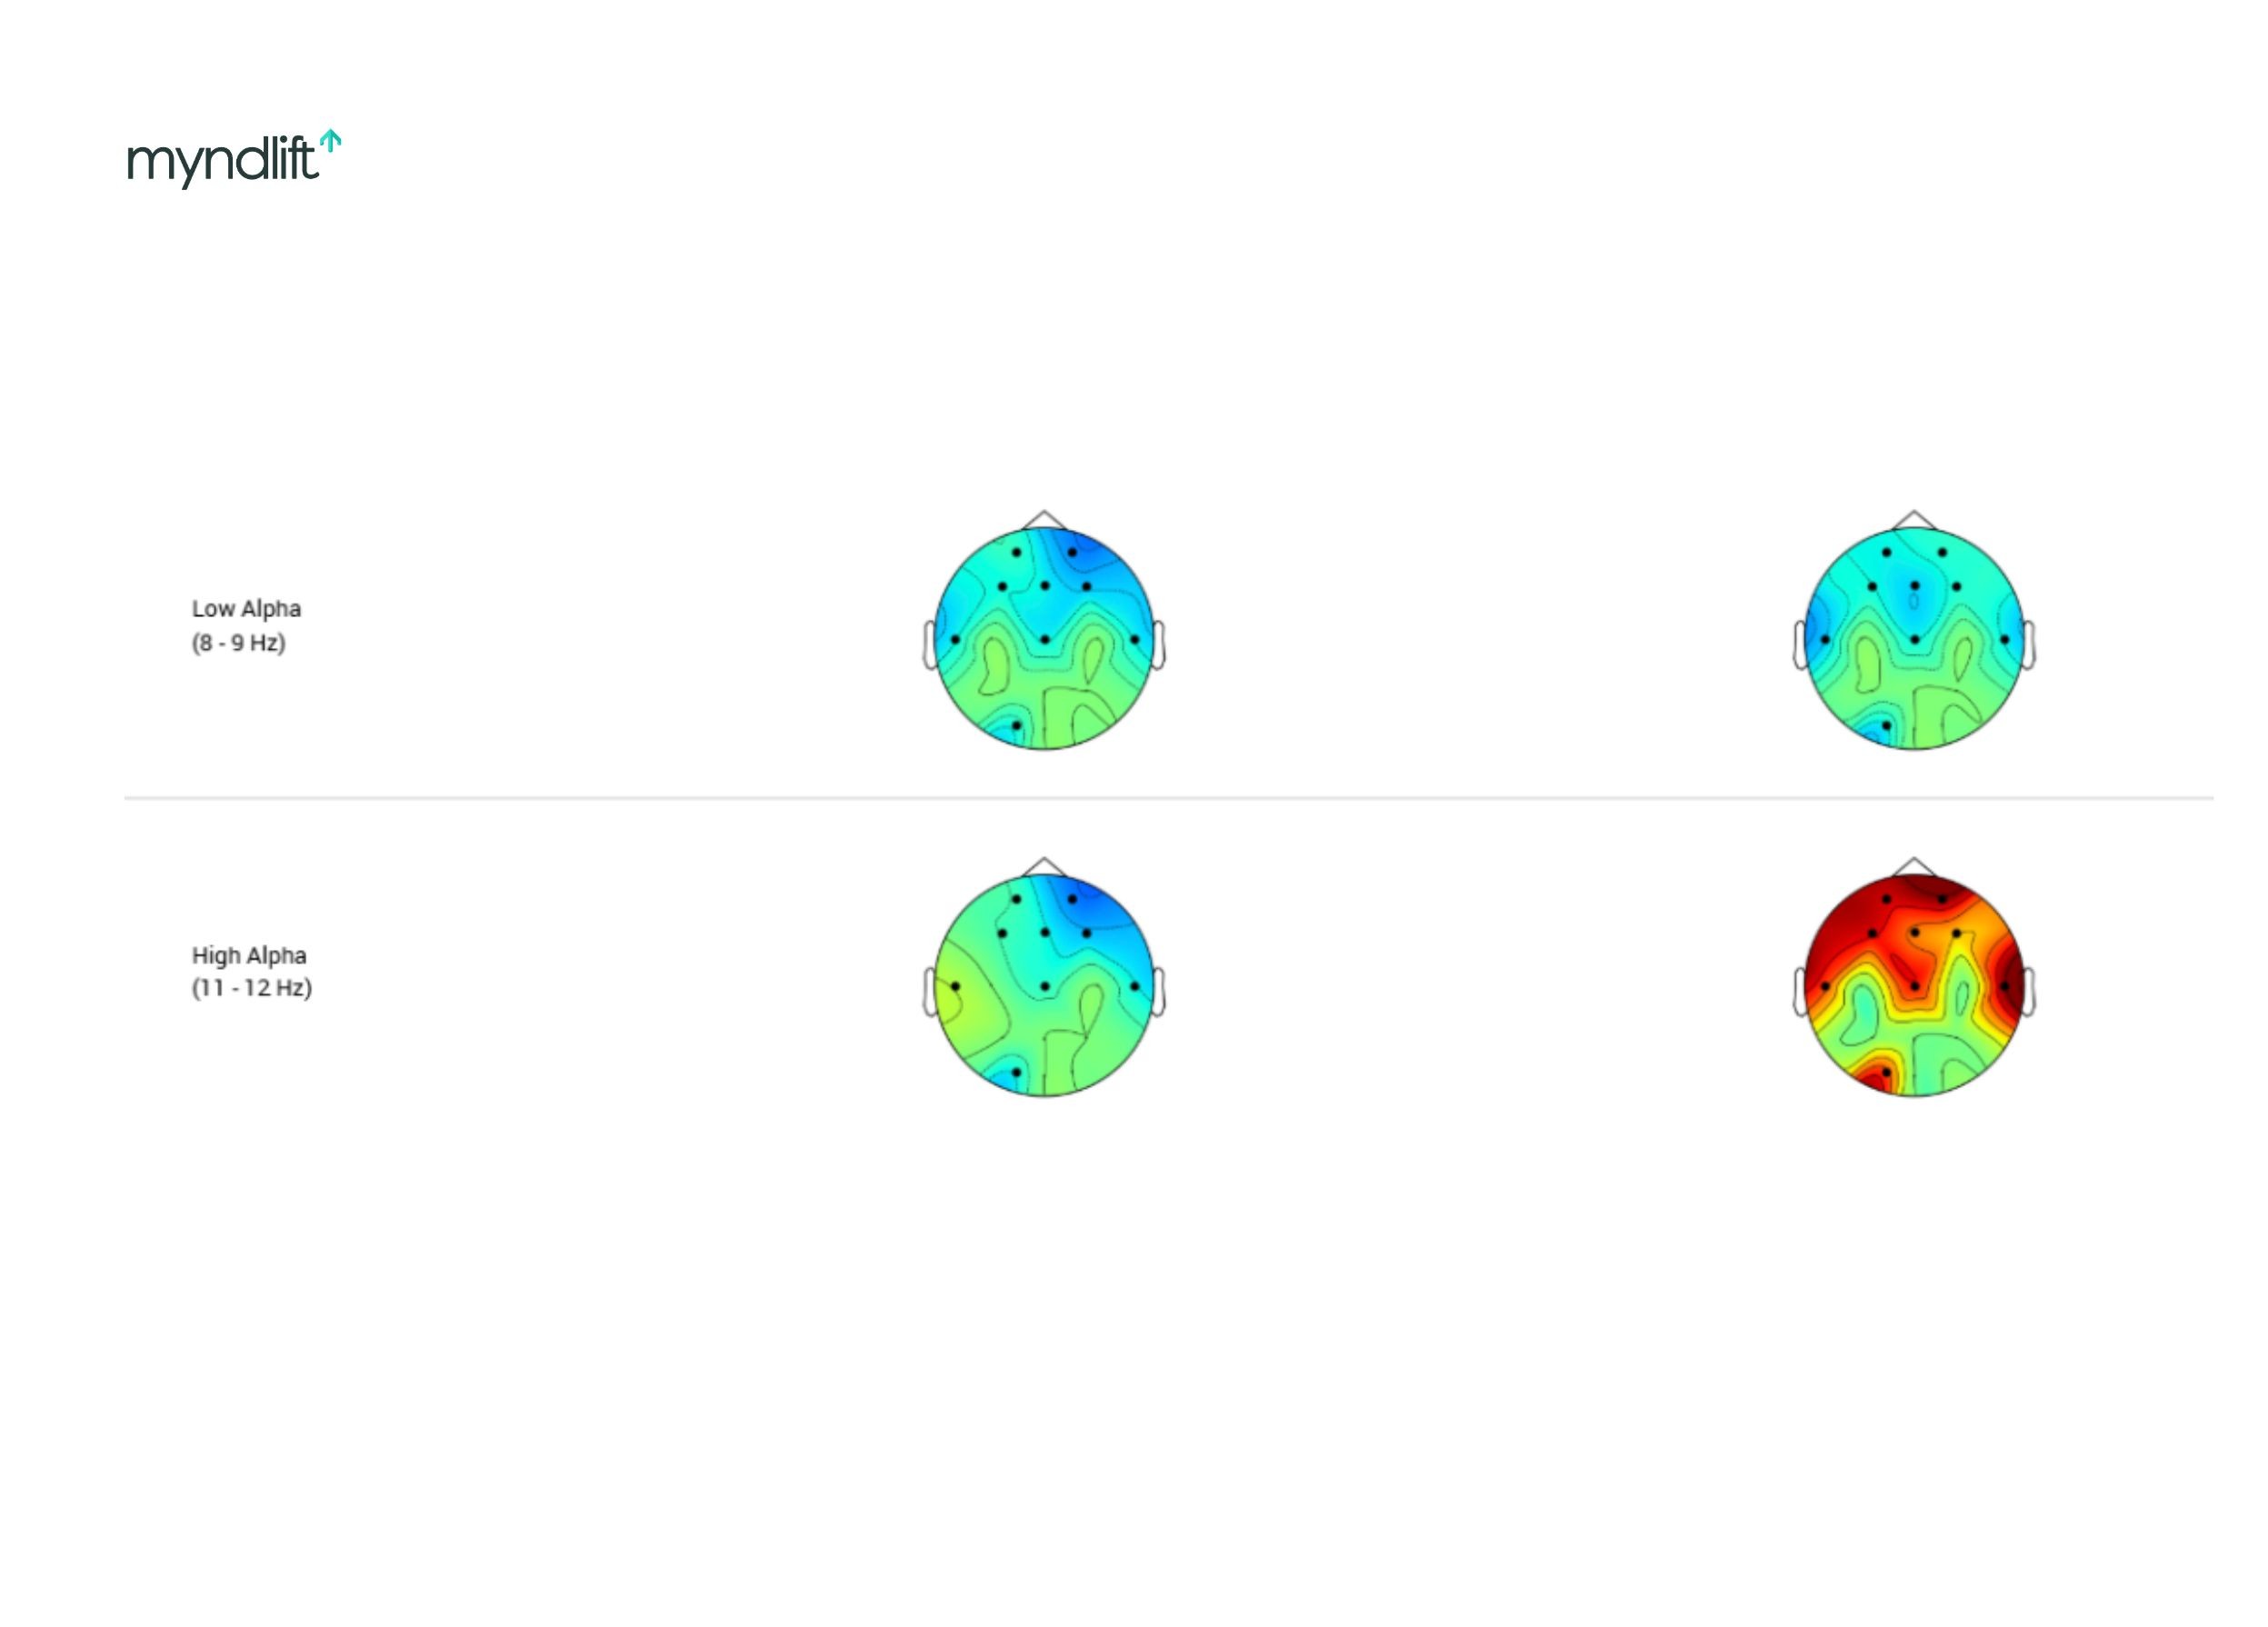
Brain maps from Dr. Trish Leigh’s clinical cases showing patterns often seen with heavy screen use, where the brain struggles to downshift into a relaxed state.
According to Dr. Leigh, these brains don’t relax naturally. They rely on external stimulation to feel neutral.
What QEEG can and can’t tell you
Dr. Leigh is careful with language. She believes in neurodiversity, as well as the idea that not every deviation is a problem.
But she’s also clear:
“Red doesn’t mean optimized. It means overused.”
A brain map provides hypotheses, but it must be interpreted alongside history, behavior, and lived experience.
And when progress shows up in the data but not in how someone feels, she goes back to the life context and asks about the client’s sleep, stress levels, habits, or relationships.
“The data doesn’t lie. It tells you where to look.”
From a qEEG brain map to training with Myndlift
Myndlift allows clinicians to turn these insights into therapist-guided neurofeedback programs that clients can complete remotely, while progress is tracked session by session.
Dr. Leigh does not monitor sessions live. She reviews the data, adjusts protocols, and lets the system do the work.
As she says, “If the protocols are right, the brain learns.”
Myndlift helps practices grow and deliver data-driven care with better outcomes. Schedule a demo today and join thousands of clinicians already seeing the difference.
FAQs
Can an “imperfect” brain map ever be a strength? For example, could elevated alpha contribute to greater creativity?
Dr. Leigh: I try to be very careful with language here. I don’t really talk about a “perfect” brain. I talk about an optimal brain, and even that can be loaded language. I’m a big believer in neurodiversity. Our brains are diverse, and context matters. What really determines whether something is relevant is whether a person feels their mind is working the way they want it to. If someone has behavioral symptoms or feels off, and we see elevations on the map, then we can start to link those patterns to their experience. From my work with high performers, I’ll say this clearly: dysregulation is usually not a sign of extra optimization. It’s more often a sign that the brain has moved away from its optimal state. If we see red alpha, that doesn’t mean someone has “extra good” alpha. It means alpha is being overused, and the brain has slid too far into neutral. That actually pulls people away from creativity and flexibility, not toward it. In practice, the closer a brain map moves toward green, the more people report feeling optimized. That said, it’s always individual.
How does neuroinflammation or silent inflammation show up on a brain map? Is it high alpha?
Dr. Leigh: It usually shows up as delta. Some practitioners will label delta directly as inflammation. I don’t do that, just to be clear. But clinically, when inflammation is present, delta is often the frequency that stands out. I’ve seen this personally as well. When I was dealing with chronic inflammatory response syndrome, my own brain map showed elevated delta. When I added that into my training, I was honestly surprised by how much delta was there. In my case, it was clearly tied to inflammation. So in short, inflammation most often presents as delta activity.
How many brainwaves should be trained in a single session?
Dr. Leigh: “Should” is a loaded word. This really is a clinician decision, and there are different philosophies. Some clinicians like to train a lot at once, and I’ll do that in certain cases if I feel it’s necessary. But in general, I follow a less-is-more approach. There’s research suggesting that training frequencies that are further apart can be easier on the brain. For example, inhibiting high beta instead of mid beta, or enhancing low beta while inhibiting high beta, rather than working on adjacent bands at the same time. Typically, I try to limit protocols to a small number of inhibits and one enhance. If I can do two inhibits and one enhance, that’s ideal. My goal is to support regulation without overloading the system.
Do you follow specific feedback percentages or threshold settings during training?
Dr. Leigh: For the most part, I follow the recommended protocols in Myndlift. Those protocols already include thresholds and electrode placements that work well for most cases. What I pay the most attention to is balance. If I’m training both hemispheres, I want the thresholds to feel consistent. I don’t want one side to be much easier or harder unless there’s a clear reason for it. That matters for both brain regulation and the client’s experience. Myndlift automatically thresholds each session based on baseline activity, which I trust. I’ll review session data, feedback percentages, and within-session changes if I need to adjust, but I try not to overcorrect unless the data clearly calls for it.
How does neurofeedback interact with stimulant medications like Ritalin or Adderall?
Dr. Leigh: If a client is on medication, I tell them to stay on it. I can’t tell anyone what to do with their medication. What I can do is explain how neurofeedback interacts with the brain. There are studies showing that neurofeedback works well alongside stimulant medications. In many cases, staying on medication while training actually helps regulation. If a client’s goal is to reduce medication, I recommend they work with their prescribing doctor. As training progresses, we often see theta decrease. If medication is reduced, theta may rise slightly, but it usually doesn’t return to baseline levels. Training continues, and regulation stabilizes again. This process can make tapering much easier for some people, but it’s always medically guided.
Q: What if a client’s brain map improves, but they don’t feel better yet?
Dr. Leigh: This happens, and I address it directly. If the data shows improvement, I show the client the data and explain exactly how their brain is regulating better across sessions. I’m very confident when I do this. Neurofeedback is often the first thing people blame when they feel off, and the last thing they credit when they feel better. I’ve seen this many times. If symptoms persist, I look at what’s happening in their life. If high beta is inhibited, it cannot increase from the training itself. So if I see a spike, I ask what was happening around that time. Often, the answer is a life stressor. If the data is improving but symptoms aren’t, something outside the training is working against regulation. Sleep is a common example. You can’t train delta down if someone is sleeping four hours a night. In those cases, the data becomes a tool for problem-solving, not a contradiction.
Do you monitor neurofeedback sessions live or afterward?
Dr. Leigh: I monitor sessions post-training. Some clinicians monitor live, and if that’s something they enjoy, that’s fine. It’s just not how I practice. I trust the system to do the work and review the data afterward to make adjustments and offer guidance. Live monitoring isn’t necessary unless you’re actively coaching someone during the session. Regulation comes from consistency, not supervision.

Related posts


